In a globally interlinked economy, knowing where your products are coming from is as important as knowing what you’re buying. Our location-based capacity insights help procurement teams zero in on regional production strengths, allowing smarter, more resilient sourcing decisions.
Why Geography Matters for Production and Procurement Strategy
Different regions specialize in different materials, processes, and infrastructure. When you understand which countries are producing the volumes you need—and which aren’t—you gain a clearer picture of potential risk zones and supply strongholds.
What You’ll Uncover
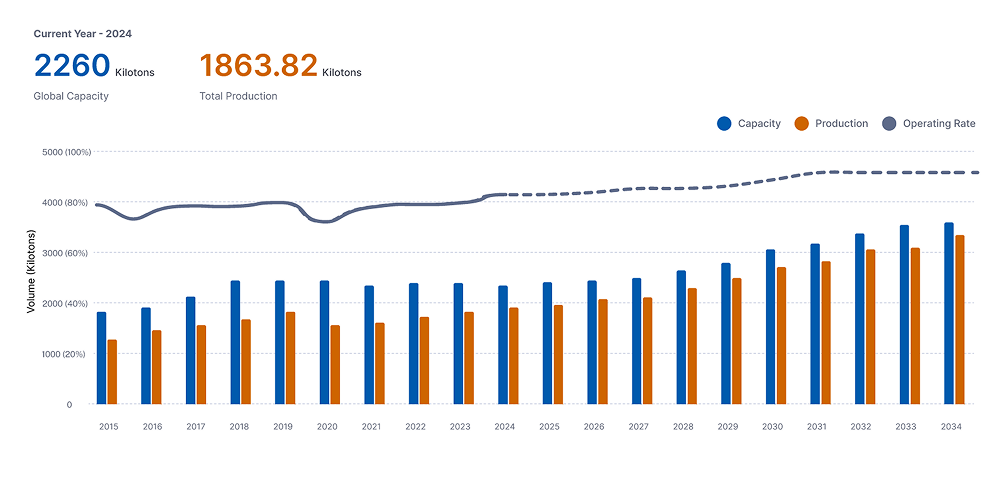
The Power of Production Mapping
Our dashboards break down global capacity at the country and region level, giving you a real-time snapshot of where your supply is rooted. From geopolitical disruptions to logistical chokepoints, stay one step ahead with hyper-localized data that helps you plan better, faster, and smarter.
 India
India China
China Japan
Japan France
 Brazil
 Saudi Arabia
Retain your market rank by PriceWatch strategy thru Market strategy battlefield
Get clear visibility into who’s actually producing your materials. Our company-level capacity data reveals production footprints of key players across geographies—helping you choose the right suppliers and avoid risky dependencies.
Why Company-Level Capacity Matters
It’s not just about the product—it’s about the producer. Understanding which companies have the capacity to meet demand (and which don’t) lets you proactively manage risk and secure supply continuity.
What You’ll Learn
Your Edge in Partner Selection
Whether you’re evaluating a new vendor or pressure-testing your existing supply base, this layer of insight helps you choose partners with real capability—not just good pitches.
Supply chain management is no longer just an operational function—it’s a strategic edge. This is where the smartest players pull ahead by building supply networks that are agile, intelligent, and built to last.
Why Supply Chains Are a Competitive Weapon
From pricing pressure to global disruptions, today’s leaders know supply chain performance directly impacts revenue, brand trust, and growth. They’re not just managing—they’re innovating.
What Sets Them Apart
Learn from the Best
Our platform tracks how top companies structure their supply networks—giving you blueprints to emulate, compete with, and surpass.
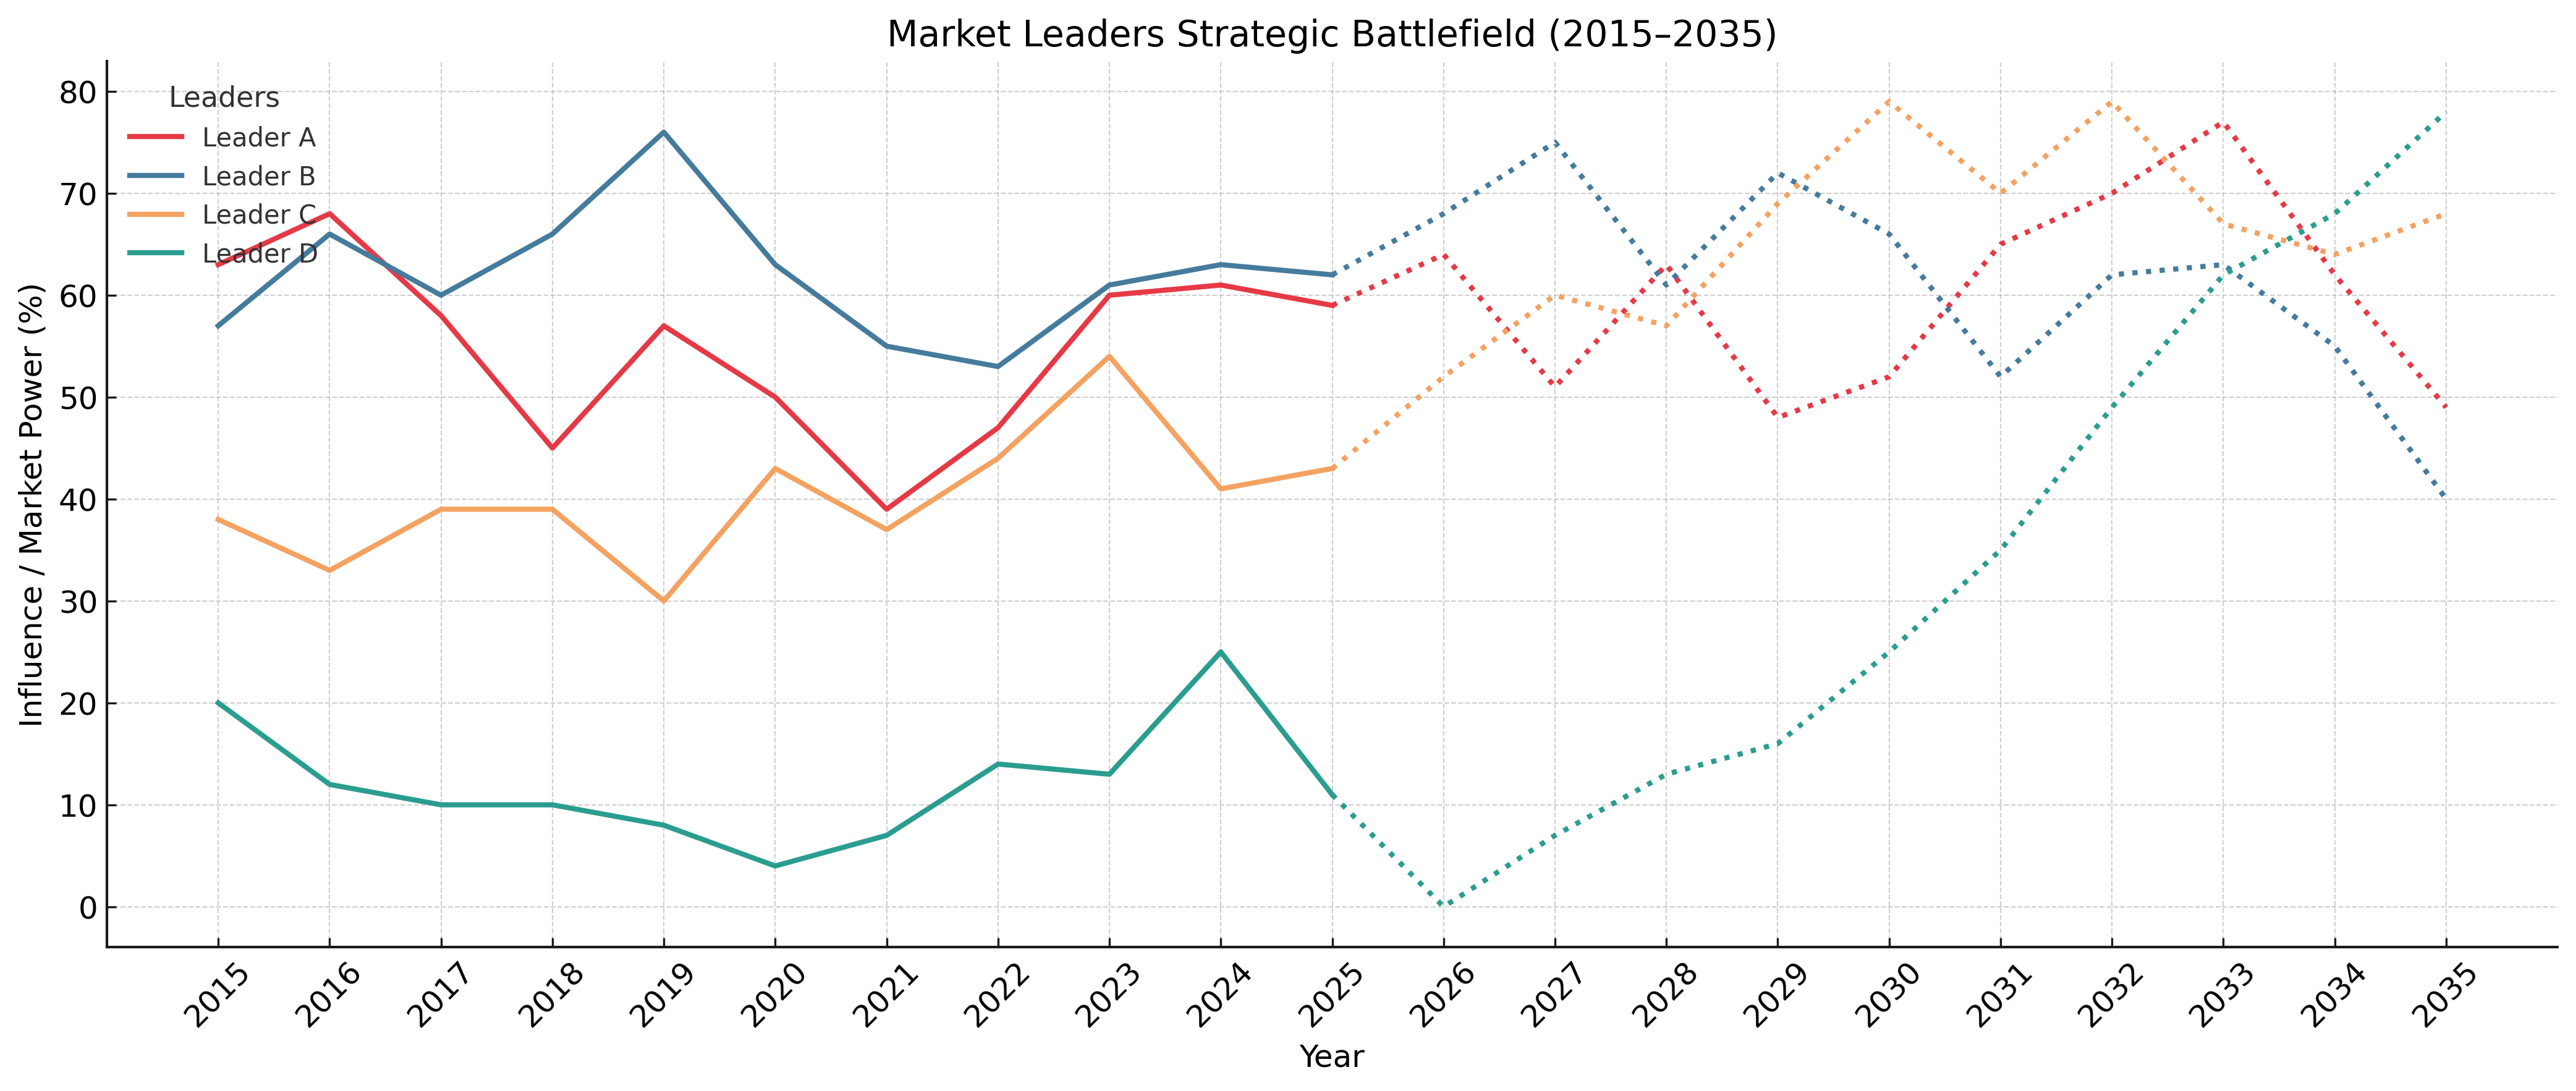
Note: This section is to be provided for top 5 players in the market. The top five market players are strategically expanding their production capacities to maintain and enhance their market positions. These projections reflect an industry-wide push for capacity growth, ensuring competitiveness and scalability in a dynamic market landscape.
In a noisy supplier landscape, who should you really be paying attention to? Our quadrant mapping tool helps you visualize the supplier ecosystem by performance and impact—so you can back the right partners.
What is Supplier Quadrant Mapping?
It’s a strategic model that categorizes suppliers into Leaders, Challengers, Niche Players, and New Entrants based on metrics like scale, innovation, reliability, and growth.
What It Helps You Do
A Clearer View of Supply Potential
Our quadrant analysis translates complex supplier data into clear strategic insight—so you can move fast, with confidence.
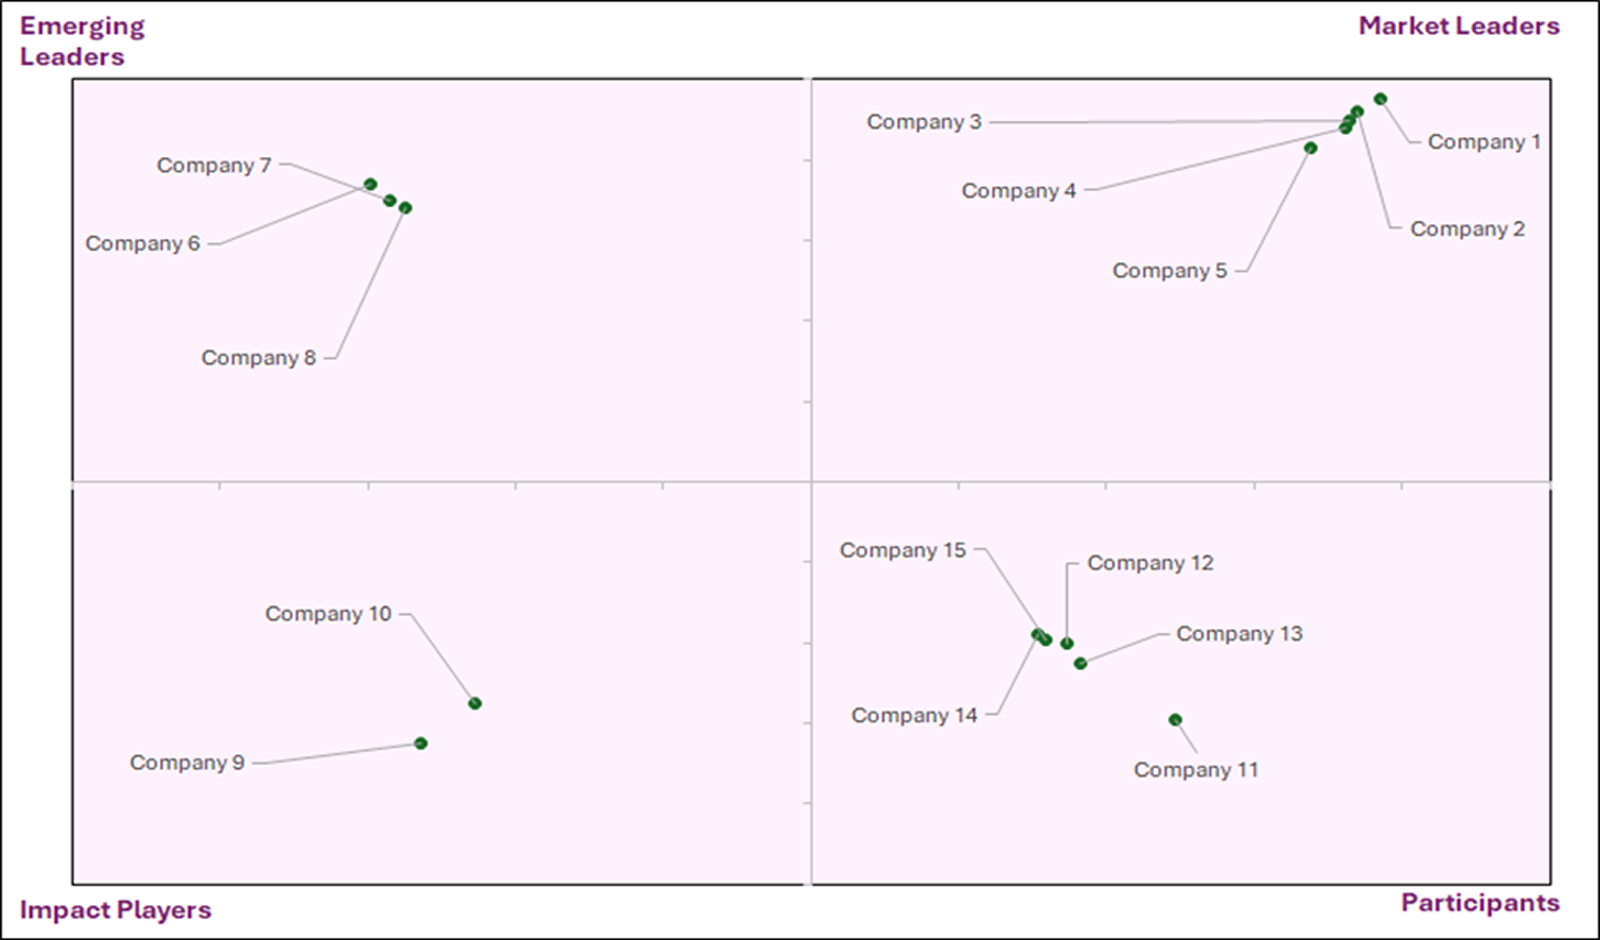
1. Market Leaders (Top Right):
2. Emerging Leaders (Top Left):
3. Impact Players (Bottom Left):
4. Participants (Bottom Right):
X-axis: Market participation/ Penetration
Y-axis: Market impact
Research Methodology: Quadrant mapping of suppliers is a strategic tool used to categorize and assess suppliers based on various criteria, such as performance, importance, market reach, or revenue generated.
For X axis: Revenue analysis and market penetration was analyzed for different players and scoring was given to each player according to the standard scale.
For Y axis: Impact on the segmental revenue and overall revenue from last 5 years of the company was analyzed and the percentage change was observed after which the companies were given score as per the scale.
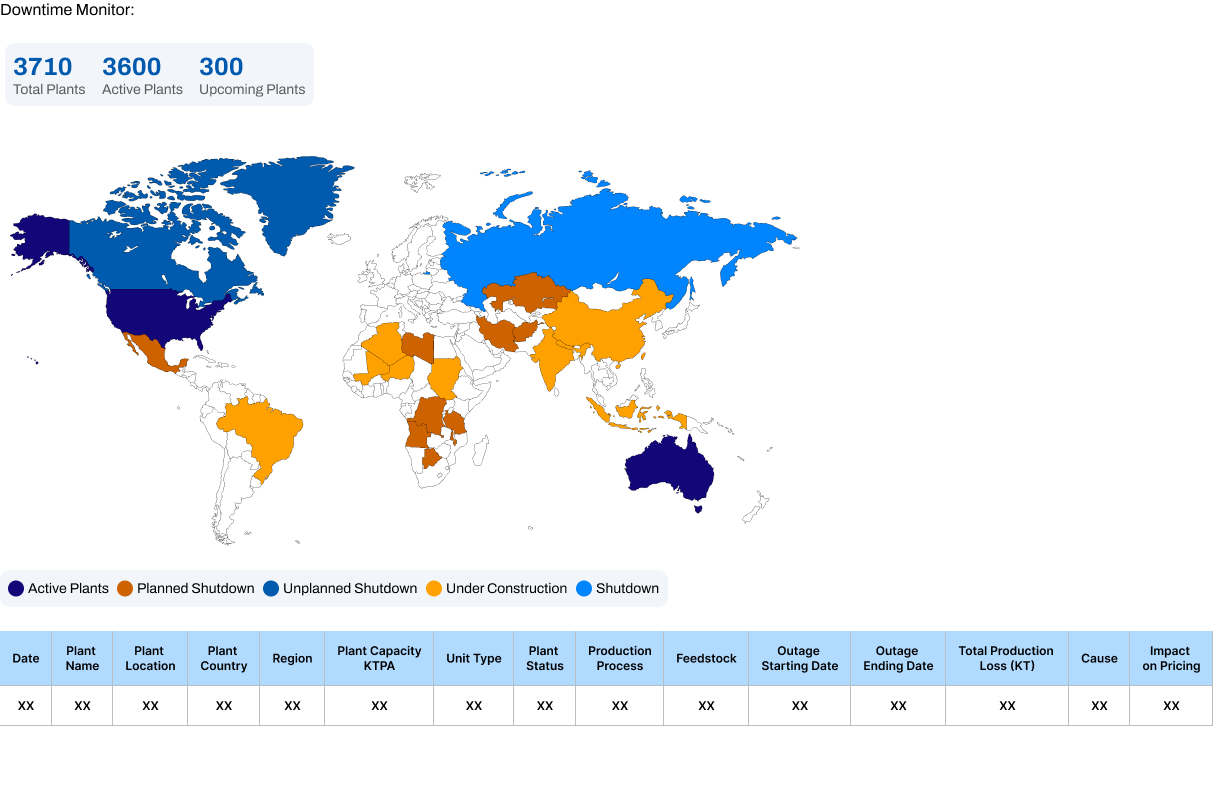
| Date | XX |
|---|---|
| Plant name | XX |
| Plant location | XX |
| Plant country | XX |
| Region | XX |
| Plant capacity KTPA | XX |
| Unity type | XX |
| Plant status | XX |
| Production process | XX |
| Feedstock | XX |
| Outage starting date | XX |
| Outage ending date | XX |
| Total production loss | XX |
| Cause | XX |
| XX |
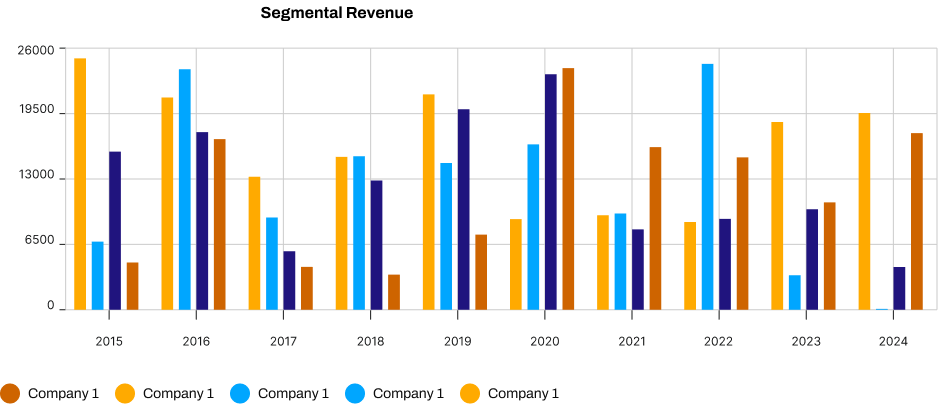
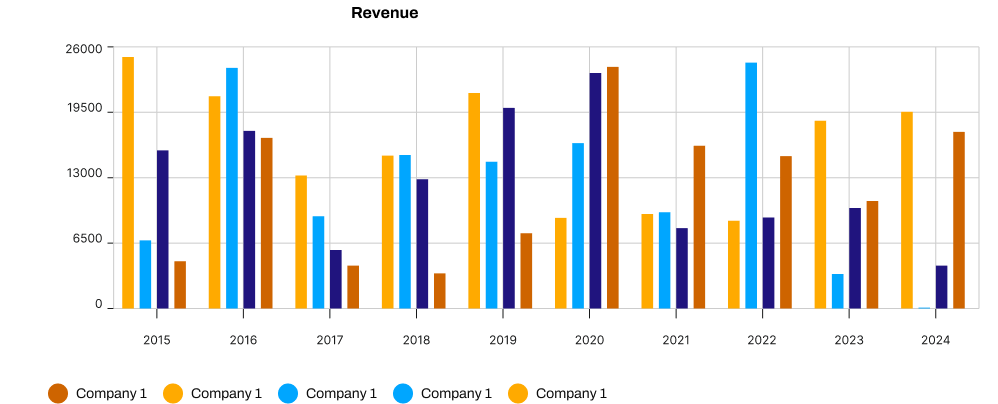
Financial health matters—especially when your operations rely on external manufacturers. Our supplier revenue data provides a clear view into overall performance and business segment growth across key players.
Why Financial Visibility Matters
A supplier’s revenue trends can reveal more than just numbers—they indicate reliability, resilience, and future readiness.
What You’ll Learn
Smarter Sourcing Starts Here
We give you the context behind the contract—so you’re not just picking a supplier, you’re picking the right one.
Plant-level visibility is your secret weapon against production delays. Our Downtime Monitor tracks what’s happening inside facilities—so you can respond fast, reduce risk, and plan better.
What You’ll Access
Why It Matters
One hour of unplanned downtime can cost thousands—or more. We give you the intelligence to spot it, solve it, and prevent it.
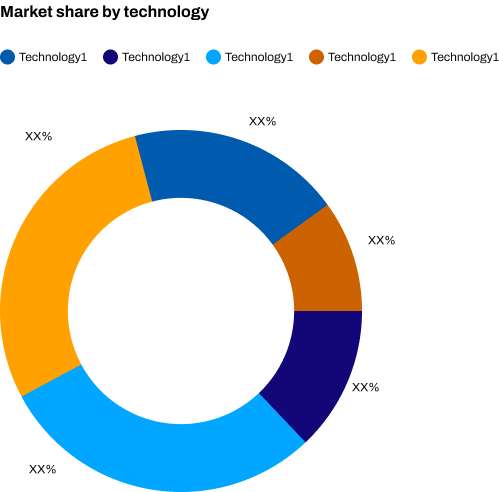
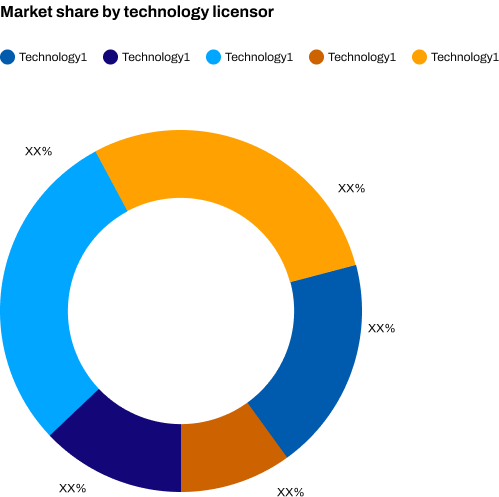
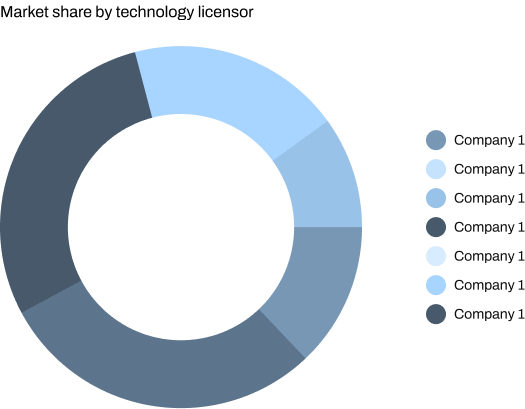
Who’s Powering the Process? Track Technology and Licensors
Behind every efficient facility is a tech stack—and a licensor—that makes it run. Our database breaks down who’s powering what, giving you visibility into the technologies that shape supply.
Why Technology Licensing Matters
It’s not just about owning machinery. It’s about adopting proven, efficient processes that scale. Partnering with the right technology licensors means faster launches, fewer mistakes, and better performance.
What You’ll Uncover
Get the Full Picture
When you know what’s running under the hood, you make sharper calls—on procurement, partnerships, and production.