Copper Wire Pricing Assessment

  • Commodity Pricing

copper wire Markets Covered: 

inIndia
deGermany
usUnited States
cnChina

copper wire Markets Covered: 

Global copper wire Price Trend, Analysis and Forecast​

Quarter 1, 2025: 
The start of 2025 continued the recovery trend with a $10,081/mt Ex-Shanghai increase, translating to a 3.44% rise. The market seems to be settling into a steady upward path, possibly reflecting balanced fundamentals, with consistent demand from key sectors like renewable energy, EV manufacturing, and infrastructure. The price increase may have been supported by continued global investment in clean energy technologies, increased demand for electric vehicle components, and steady construction activity. Supply side constraints likely remained a concern, though perhaps less acute than earlier in 2024, contributing to a balanced but firm upward price trend. 

Quarter 4, 2024: 
In the final quarter of 2024, prices rebounded with an increase of $9,746/mt Ex-Shanghai with 0.89%, signaling a recovery in demand or renewed supply concerns. This recovery suggests that the Q3 dip may have been temporary or over-corrected. The market may have stabilized on the back of year-end industrial demand or expectations of tighter supply entering 2025. 

Q3 2024 
After two strong quarters, copper wire prices corrected in Q3, declining by $9,660/mt Ex-Shanghai with 3.44%. This drop is likely to represent a market adjustment following the rapid gains earlier in the year. The correction could have been driven by easing supply fears, lower seasonal demand, or broader economic cooling. It underscores the commodity market’s sensitivity to short-term changes in both supply chains and macroeconomic signals. 

Q2 2024 
The bullish momentum accelerated significantly in Q2, with prices jumping $10,004/mt Ex-Shanghai, a substantial 16.48% increase. This sharp rise suggests a surge in demand or a significant tightening in supply. Factors such as global electrification initiatives, increased manufacturing output, or concerns over copper mining disruptions may have played a role in pushing prices sharply higher during this period. 

Q1 2024
Copper wire prices saw a healthy increase of $8,589/mt Ex-Shanghai, marking a 3.55% rise. This upward trend likely reflected strong demand at the beginning of the year, possibly driven by infrastructure projects, recovering industrial activity, or anticipated supply constraints. The moderate percentage gain indicated steady market confidence without extreme volatility. Production capacity and export efficiency helped maintain a stable market. The increase in prices, while modest, reflected a healthy demand-supply balance and set a solid foundation for future growth in the copper wire sector throughout the year. 

India copper wire Price Trend, Analysis and Forecast

Q1 2025 
India entered the new year on a positive note in Q1 2025, recording a solid price increase of $10,774/MT Ex-Bhiwandi, which translates to a 4.93% growth. This steady rise indicated strengthening economic fundamentals, renewed industrial momentum, and a more optimistic market outlook. The growth could be attributed to increased activity in key sectors such as infrastructure, steel, and energy, coupled with improving global trade conditions. Rising consumer and business confidence likely contributed to stronger domestic demand. This quarter’s performance suggested a healthy recovery path and hinted at sustained momentum heading into the remainder of 2025. 

Q4 2024 
The final quarter of 2024 brought signs of recovery, as prices increased slightly by $10,267/MT Ex-Bhiwandi, amounting to a 0.81% gain. While the growth was modest, it marked a return to positive territory and suggested early signs of market stabilization. This improvement might have been driven by year-end demand, inventory replenishment, or seasonal buying cycles. Businesses likely resumed procurement after holding back in Q3, while confidence in economic fundamentals began to restore. This quarter set the stage for a potentially stronger start in 2025, as it helped reverse the negative sentiment from the previous decline. 

Q3 2024 
In a clear shift from the previous quarter, Q3 2024 experienced a substantial downturn, with prices dropping by $10,185/MT Ex-Bhiwandi, representing a 4.61% decline. This correction could have been driven by multiple factors including market saturation, reduced procurement due to high inventory levels, or easing of international demand. It may also reflect a natural correction following the sharp rise in Q2. External factors such as geopolitical uncertainties, global commodity price cooling, or currency fluctuations may have influenced the decline. The market sentiment during this period turned cautious, with buyers and suppliers taking a more conservative approach.

Q2 2024 
The second quarter of 2024 witnessed a significant surge in prices, with an increase of $10,677/MT Ex-Bhiwandi, marking a strong 15.94% rise the highest quarterly gain in the period under review. This sharp upswing likely stemmed from a combination of strong industrial demand, possible supply constraints, and favorable global pricing trends. Seasonal factors, such as increased infrastructure projects post-monsoon and higher energy demand, may have also contributed. Additionally, supportive government policies or increased export activity might have played a role in fueling this sharp increase. The market sentiment during this quarter was notably bullish. 

Q1 2024 
India began the year 2024 with a moderate upward trend, as prices increased by $9,210/MT Ex-Bhiwandi, reflecting a 1.38% growth. This modest rise indicated a stable and balanced market environment, likely supported by consistent domestic demand across sectors such as construction, infrastructure, and manufacturing. The quarter did not exhibit any extreme volatility, suggesting that both supply and demand were relatively aligned. This stability may also have been influenced by broader macroeconomic indicators, such as steady GDP growth, controlled inflation, and moderate commodity import activity. 

copper wire Parameters Covered: 

  • Copper Ore    
  • China  
  • Copper Wire (Electrical, Automotive, Construction, Industrial Machinery, Renewable Energy, Telecommunication)

copper wire Parameters Covered: 

  • Copper Ore    
  • China  
  • Copper Wire (Electrical, Automotive, Construction, Industrial Machinery, Renewable Energy, Telecommunication)
  • Germany
  • USA
  • India  

Why PriceWatch?

PriceWatch is your trusted resource for tracking global copper wire price trends. Our platform delivers real-time data and expert analysis, offering deep insights into the key factors driving price fluctuations in the copper wire market. By monitoring critical events such as geopolitical tensions, supply chain disruptions, and economic shifts, PriceWatch keeps you fully informed of market dynamics.

In addition, PriceWatch provides detailed forecasts and updates on production capacities, enabling you to anticipate market changes and make well-informed decisions. With PriceWatch, you gain a competitive edge in understanding all the elements that influence copper wire prices worldwide. Stay ahead of the curve with PriceWatch’s reliable, accurate, and timely copper wire market data.

Track PriceWatch's copper wire price assessment on a weekly basis since 2015 onwards, along with short-term forecasts, and get access to the detailed report in a downloadable format.

Historically, several events have caused significant fluctuations in Copper Wire prices

  • Global Supply Chain Disruption (2022): The war in Ukraine and other geopolitical tensions disrupted supply chains, leading to price volatility in various commodities, including copper Wire. These events underscore the copper cathode market’s vulnerability to global disruptions and highlight the need for continuous monitoring of supply-demand dynamics.  
  • Global Economic Downturn (2019-2020): The global economic slowdown, particularly in sectors like steel and automotive, led to reduced demand for copper Wire, resulting in lower prices.  
  • COVID-19 Pandemic (2019-2020): The global pandemic caused a significant decline in demand for copper Wire-intensive industries, such as construction and automotive manufacturing, causing prices to plummet.  

Data Collection and Sources​

  • Real-Time Market Data: PriceWatch aggregates real-time pricing data from a diverse range of sources, including global commodity exchanges, industry reports, and proprietary databases. This ensures that our assessments reflect the most current market conditions. 
  • On-the-Ground Intelligence: Our team gathers insights directly from key market participants, including producers, suppliers, traders, and end-users, across major copper wire production hubs. This ground-level intelligence is crucial for understanding localized market dynamics. 
  • Supply Chain Monitoring: We track the entire copper wire supply chain, from raw material availability to production and distribution channels. This includes monitoring feedstock prices, production capacities, and transportation logistics. 

Event Tracking and Impact Analysis​

  • Geopolitical Tensions: PriceWatch continuously monitors global geopolitical developments, such as conflicts or trade disputes, which can significantly impact copper wire prices. Our analysis includes potential disruptions to supply chains and their immediate and long-term effects on pricing. 
  • Natural Disasters and Climate Events: We assess the impact of natural disasters, such as hurricanes or winter storms, on copper wire production facilities, particularly in vulnerable regions like the APAC coasts. These events are factored into our price forecasts and supply outlooks. 
  • Economic Shifts: PriceWatch evaluates macroeconomic trends, including global economic growth, inflation rates, and sector-specific demand (e.g., automotive, construction) to predict shifts in copper wire demand and corresponding price movements. 

Production Capacity and Supply Analysis

  • Current Production Monitoring: We maintain a comprehensive database of global copper wire production facilities, tracking their operational status, maintenance schedules, and output levels. This allows us to assess current supply availability accurately. 
  • Future Capacity Projections: Our research includes detailed forecasts of upcoming copper wire production capacities, factoring in new plant constructions, expansions, and technological advancements. This helps in predicting future supply trends and potential price stabilization. 

Demand Forecasting

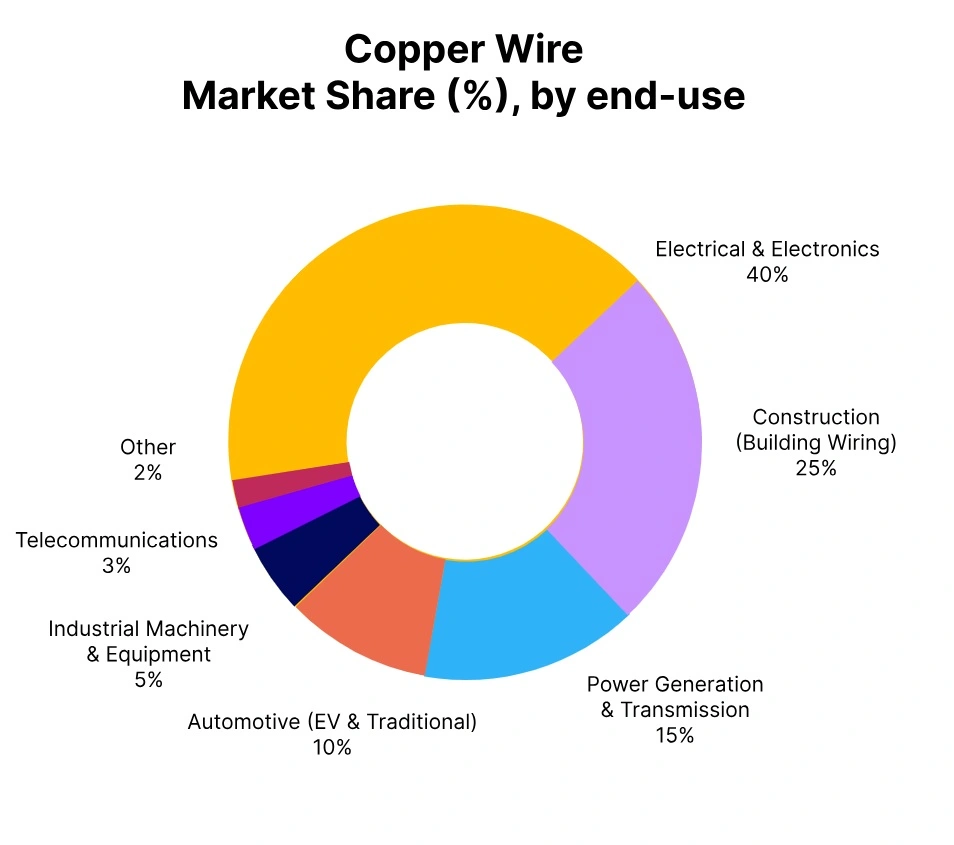
  • Sectoral Demand Analysis: PriceWatch provides an in-depth analysis of demand trends across key sectors, including electrical and electronics, automotive, and construction. We track year-on-year demand growth and project future consumption patterns based on economic indicators and industry developments. 
  • Global Demand Dynamics: Our methodology considers regional demand variations and how they influence global copper wire pricing. This includes understanding the impact of shifts in manufacturing bases, trade policies, and environmental regulations.

Pricing Model Development

  • Dynamic Pricing Models: PriceWatch utilizes advanced econometric models to forecast copper wire prices, incorporating real-time data, historical trends, and projected market conditions. Our models are continuously refined to enhance accuracy and predictive power. 
  • Scenario Analysis: We conduct scenario-based assessments to evaluate potential future market conditions. This includes best-case, worst-case, and most-likely scenarios, helping our clients prepare for a range of market outcomes. 

Reporting and Client Support

  • Comprehensive Reports: Our clients receive detailed reports that include current price assessments, future price forecasts, and in-depth analysis of market drivers. These reports are designed to be actionable, providing clear insights and recommendations. 
  • Ongoing Support: PriceWatch offers continuous updates and personalized support to our clients, ensuring they have the most up-to-date information to make informed decisions. Our experts are available to discuss specific market developments and provide tailored advice. 

Molecular Weight[g/mol]

CAS No

HS Code

740819 

Molecular Formula

copper wire

Copper wire is a high-conductivity, malleable metallic wire that is widely used across various industrial and consumer applications. It is manufactured through the extrusion of high-purity copper is utilized in electrical, telecommunications, automotive, and construction industries due to its excellent electrical conductivity, formability, and corrosion resistance. Copper wire is available in various gauges and is typically wound into coils or packaged in reels for shipping and handling.

Packaging Type

Steel Strap, Palletized Bundles or Strapped Stacks

Grades Covered

Del Alabama, Ex-Shanghai, Ex-Bhiwandi, FD-Willich

Incoterms Used

FOB Shanghai (China), Ex-Mumbai (India), Del Alabama (USA), FD-Willich (UK)

Synonym

Electrolytic Copper Wire, High-Purity Copper Wire

PriceWatch Quotation Terms:

25-30MT

Ex-Location: This incoterm refers to a shipping agreement where the seller makes the goods available at their premises, and the buyer is responsible for all transportation costs, including shipping, insurance, and any other fees.
CIF: CIF refers to the Cost, Insurance, and Freight (CIF) terms for goods. Under CIF terms, the seller is responsible for the cost of goods, insurance, and freight charges until the goods reach the port of destination.
FD: FD stands for Free Delivered where the seller takes full responsibility for delivering goods to the location/port. This ensures the buyer receives the goods at the designated port with all necessary costs, except import duties, covered.
FOB: FOB refers to the Free On-Board shipping term, where the seller is responsible for the cost and risk of delivering the goods to the port. Once the goods are on board the vessel, the responsibility shifts to the buyer for all costs, including shipping and insurance.

Property / Specification  Typical Value / Range 
Material  Electrolytic Tough Pitch Copper (ETP), >99.9% Cu 
Standard  ASTM B3 / IS 8130 / IEC 60228 
Diameter Range  0.2 mm – 8 mm (custom sizes available) 
Conductor Type  Solid  
Tensile Strength  200 – 250 MPa 
Elongation  ≥ 20% 
Electrical Conductivity  ≥ 100% IACS  
Resistivity  ≤ 0.017241 ohm·mm²/m at 20°C 
Annealing Temperature  250°C – 450°C 


Applications

  • Electrical Industry:
    Power transmission cables, transformers, switchgear, busbars, and wiring systems. 
  • Automotive Industry:
    EV battery packs, wiring harnesses, motors, and charging stations. 
  • Construction Industry:
    Electrical installations in residential and commercial buildings, plumbing pipes, roofing systems. 
  • Industrial Machinery:
    Manufacturing of tubes, rods, conductors, motor windings, and electrical components. 
  • Consumer Electronics:
    PCBs, semiconductors, connectors, and heat dissipation systems in devices. 
  • Renewable Energy:
    Solar PV wiring, wind turbine components, and battery energy storage systems. 
Copper Wire price provided by PriceWatch is a base price and excludes VAT/Taxes, discounts, or offers. The information herein is accurate to the best of our knowledge as of the date indicated and is provided solely for the convenience of our customers as a reference for copper wire. PriceWatch disclaims any warranties or representations regarding the accuracy of results derived from this information. It is the sole responsibility of the user to assess the suitability of the product for their specific application. This document does not constitute an endorsement to use the product in violation of any applicable patent rights.

Copper wire prices are driven by:

Global Copper Prices

Copper wire is made from refined copper, so its price is directly linked to LME copper prices.

Supply & Demand

High global demand (especially from construction, power, and EV sectors) drives prices up.

Cost of Raw Copper

Fluctuations in the cost of copper cathodes or scrap copper directly affect wire pricing.

Energy Costs

Copper smelting and wire drawing are energy-intensive; rising electricity or fuel prices increase costs.

Labor & Manufacturing Costs

Wages, automation levels, and production efficiency impact the final cost of copper wire.

Copper wire is essential for a wide range of industries, including construction, electronics, automotive, and energy. When copper wire prices rise, the costs of products dependent on copper wires such as electrical systems, vehicles, and appliances—also increase. This price escalation can contribute to inflationary pressures across multiple sectors of the economy.

PriceWatch offers:
• Real-time copper wire pricing and trend analysis
• Market outlook reports
• Risk insights based on global events and policies
• Weekly pricing assessments and procurement intelligence tools

Some of the key benefits of using PriceWatch include: 

 Real-time Data: Access to up-to-date market intelligence and data on commodity supply chains. 

Expert Analysis: Insights from industry experts to interpret market trends and identify potential risks. 

Risk Assessment: Tools to assess supply chain vulnerabilities and develop mitigation strategies. 

Benchmarking: Comparisons of commodity prices and sourcing practices to optimize procurement decisions.

PriceWatch Login