Ammonia G.I.O Tracker: Plant-Level Capacity and Daily Disruption Tracking & Impact Assessment Since 2015

Overview

The global Ammonia market is characterized by a concentrated production base, capital-intensive infrastructure, and interconnected supply chains where disruptions can extend well beyond the Haber–Bosch production unit.

GIO Tracker delivers daily asset-level intelligence on Ammonia facilities covering capacity, production process, feedstock dependency, operational status, and outage history across all major producing regions. From ammonia synthesis utilisation rates to total production loss by cause, every data point is captured at the facility level and updated every day. Access the operational intelligence, disruption signals, and pricing impact data needed to stay ahead of supply shifts before they reach the market.

40++ Countries
250++ Production Facilities
160++ Operating Companies
190+ MMTPA Annual Capacity Tracked

Ammonia Downstream Impact Mapping

Ammonia sits at the core of fertilizer and industrial value chains, serving as the foundational input from which the broader agriculture, refrigeration, and chemical industries derive their essential functionality. As the primary output of the Haber-Bosch process, Ammonia directly influences urea, ammonium nitrate, ammonium sulfate, and a wide range of downstream nitrogen-based products.

Its production is inherently capital-intensive and operationally rigid, meaning that capacity losses at the Ammonia stage are rarely absorbed quickly and tend to propagate through the value chain with outsized force. Supply disruptions at the Ammonia stage transmit rapidly across fertilizer-dependent crop cycles, explosives manufacturing, refrigeration systems, and industrial applications, altering trade flows, inflating input costs for fertilizer blenders and chemical producers, and tightening regional availability in ways that can persist well beyond the initial outage.

Strategic Visibility – Ammonia G.I.O Tracker

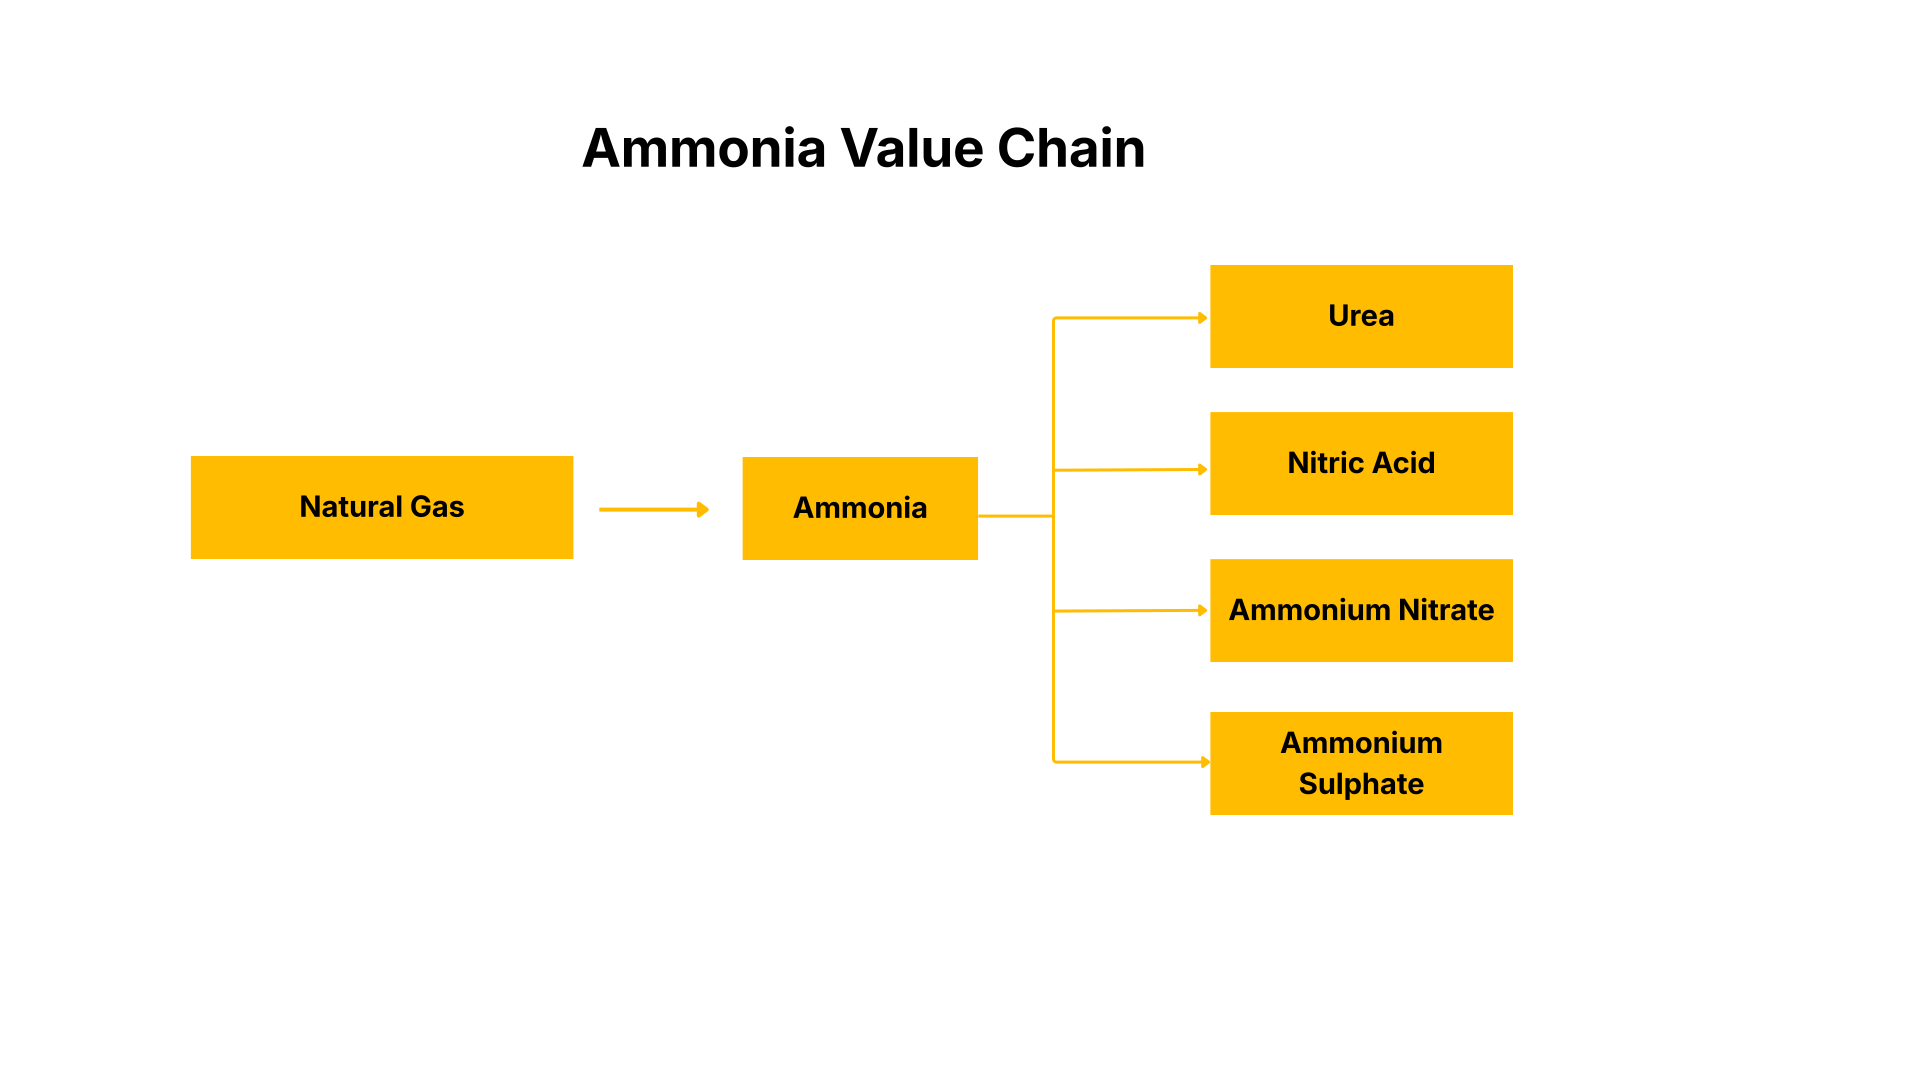
Ammonia supply is concentrated, capital-intensive, and slow to replace. When capacity goes offline, price reactions are nonlinear. Get GIO Tracker for early warning on nonlinear Ammonia supply shocks across the fertilizer and industrial value chain.

Put GIO Tracker to work across your portfolio to surface those stress points early, quantify at plant-level how outages will ripple through urea, ammonium nitrate, refrigeration, and key end-use sectors, and turn hidden operational risk into visible, actionable signals before it cascades across the agricultural and chemical value chain.

Price Watch™ Ammonia G.I.O Tracker Coverage

Global Overview

Global Ammonia production reached over 150+ million tons in 2025, concentrated in natural gas-dominant regions like Asia (China/India: 63+ Mtpa combined), North America (USA/Trinidad: 25+ Mtpa combined), Europe (Russia/Germany: 13+ Mtpa combined) and Middle East & Africa (Iran/Saudi Arabia: 12M+ tons combined). GIO Tracker provides plant-level visibility across 250+ facilities, tracking capacity shifts and disruptions to forecast supply risks amid steady capacity growth and vulnerability to outages.

The Global Ammonia GIO Tracker delivers structured, plant-level operational intelligence across major producing regions. Built on historical tracking since 2015, it monitors 250+ facilities worldwide, combining capacity, utilization, and real-time disruption signals to reveal supply flashpoints in concentrated Ammonia markets that drive global fertilizers, explosives, and industrial applications.

Asia Pacific Ammonia Plant Tracking

Tracks 120+ plants across the region in key fertilizer and industrial clusters. Monitors environmental shutdowns, natural gas feedstock shortages, and monsoon risks that tighten regional and global ammonia flows.

  • China Ammonia Plant Tracking: Covers 70+ facilities representing over 25% of global capacity (48+ Mtpa), delivering daily intelligence on winter gas curtailments, flood outages, and coal-to-gas conversion policies that signal national supply shifts impacting global urea and fertilizer markets.
  • India Ammonia Plant Tracking: Monitors 25+ facilities representing over 7% of global capacity (15+ Mtpa), providing real-time updates on gas supply disruptions, subsidy reforms, and capacity expansions supporting India’s agricultural self-sufficiency drive.

North America Ammonia Plant Tracking

Tracks 40+ plants across the region in key fertilizer and industrial clusters. Monitors environmental shutdowns, natural gas feedstock shortages, and monsoon risks that tighten regional and global ammonia flows.

  • U.S. Ammonia Plant Tracking: Monitors 20+ facilities representing over 9% of global capacity (19+ Mtpa), capturing daily restarts, natural gas feedstock disruptions, and efficiency upgrades as domestic urea, nitrate, and fertilizer production accelerates.
  • Trinidad Ammonia Plant Tracking: Monitors 4+ facilities representing over 2% of global capacity (5+ Mtpa), providing real-time updates on LNG supply interruptions, maintenance turnarounds, and export terminal bottlenecks supporting regional agricultural exports.

Europe Ammonia Plant Tracking

Tracks 40+ plants under intensifying energy transition pressures across major European fertilizer hubs. Issues real-time alerts on natural gas shortages, carbon compliance shutdowns, and hydrogen supply disruptions that materially tighten ammonia flows.

  • Germany Ammonia Plant Tracking: Monitors 6+ facilities representing over 2% of global capacity (4+ Mtpa), providing early warning on energy-driven curtailments, emissions-compliance shutdowns, and green ammonia conversions that reshape regional fertilizer and industrial supply.
  • Russia Ammonia Plant Tracking: Monitors 10+ facilities representing over 4% of global capacity (9+ Mtpa), tracking gas supply constraints, sanctions-related export disruptions, and maintenance turnarounds impacting European and global urea markets.

Middle East & Africa Ammonia Plant Tracking

Tracks 50+ plants across the region in key fertilizer and industrial clusters. Monitors environmental shutdowns, natural gas feedstock shortages, and monsoon risks that tighten regional and global ammonia flows.

  • Saudi Arabia Ammonia Plant Tracking: Monitors 6+ facilities representing over 3% of global capacity (6+ Mtpa), tracking gas supply constraints, scheduled maintenance tie-ins, and seasonal operational slowdowns that drive regional tightness.
  • Iran Ammonia Plant Tracking: Covers 10+ facilities representing over 3% of global capacity (6+ Mtpa), alerting on gas and ethylene feedstock interruptions, high-heat derates, and export-terminal bottlenecks affecting regional petrochemical supply.

South America Ammonia Plant Tracking

Monitors 2+ facilities across the region. Monitors environmental shutdowns, natural gas feedstock shortages, and monsoon risks that tighten regional and global ammonia flows.

  • Brazil Ammonia Plant Tracking: Covers 1 facility representing 0.2+ Mtpa capacity, tracking gas supply constraints, scheduled maintenance tie-ins, and seasonal operational slowdowns that drive regional tightness.

Why Ammonia G.I.O Tracker

Ammonia G.I.O Tracker – Comprehensive Market Coverage & Intelligence Dashboard

Asset-Level Facility Intelligence

Regional Coverage

Asia Pacific

  • Ammonia Capacity (Ktpa) at plant-level by Feedstock Type and Production Process – Asia Pacific
  • Ammonia Capacity (Ktpa) at plant-level by Product Type and Unit Type – Asia Pacific
  • Count of Ammonia Plants with overall operational capacity – Asia Pacific
  • Ammonia Plants by Capacity (Ktpa) and Current Status – Asia Pacific
  • Ammonia Plant details (location, region, year of commissioning) – Asia Pacific
  • Announced and Upcoming Ammonia Plants with Capacity – Asia Pacific

Europe

  • Ammonia Capacity (Ktpa) at plant-level by Feedstock Type and Production Process – Europe
  • Ammonia Capacity (Ktpa) at plant-level by Product Type and Unit Type – Europe
  • Count of Ammonia Plants with overall operational capacity – Europe
  • Ammonia Plants by Capacity (Ktpa) and Current Status – Europe
  • Ammonia Plant details (location, region, year of commissioning) – Europe
  • Announced and Upcoming Ammonia Plants with Capacity – Europe

North America

  • Ammonia Capacity (Ktpa) at plant-level by Feedstock Type and Production Process – North America
  • Ammonia Capacity (Ktpa) at plant-level by Product Type and Unit Type – North America
  • Count of Ammonia Plants with overall operational capacity – North America
  • Ammonia Plants by Capacity (Ktpa) and Current Status – North America
  • Ammonia Plant details (location, region, year of commissioning) – North America
  • Announced and Upcoming Ammonia Plants with Capacity – North America

Middle East & Africa

  • Ammonia Capacity (Ktpa) at plant-level by Feedstock Type and Production Process – Middle East & Africa
  • Ammonia Capacity (Ktpa) at plant-level by Product Type and Unit Type – Middle East & Africa
  • Count of Ammonia Plants with overall operational capacity – Middle East & Africa
  • Ammonia Plants by Capacity (Ktpa) and Current Status – Middle East & Africa
  • Ammonia Plant details (location, region, year of commissioning) – Middle East & Africa
  • Announced and Upcoming Ammonia Plants with Capacity – Middle East & Africa

South America

  • Ammonia Capacity (Ktpa) at plant-level by Feedstock Type and Production Process – South America
  • Ammonia Capacity (Ktpa) at plant-level by Product Type and Unit Type – South America
  • Count of Ammonia Plants with overall operational capacity – South America
  • Ammonia Plants by Capacity (Ktpa) and Current Status – South America
  • Ammonia Plant details (location, region, year of commissioning) – South America
  • Announced and Upcoming Ammonia Plants with Capacity – South America

Country-Level Coverage

China

  • Ammonia Capacity (Ktpa) at plant-level by Feedstock Type and Production Process – China
  • Ammonia Capacity (Ktpa) at plant-level by Product Type and Unit Type – China
  • Count of Ammonia Plants with overall operational capacity – China
  • Ammonia Plants by Capacity (Ktpa) and Current Status – China
  • Ammonia Plant details (location, region, year of commissioning) – China
  • Announced and Upcoming Ammonia Plants with Capacity – China

India

  • Ammonia Capacity (Ktpa) at plant-level by Feedstock Type and Production Process – India
  • Ammonia Capacity (Ktpa) at plant-level by Product Type and Unit Type – India
  • Count of Ammonia Plants with overall operational capacity – India
  • Ammonia Plants by Capacity (Ktpa) and Current Status – India
  • Ammonia Plant details (location, region, year of commissioning) – India
  • Announced and Upcoming Ammonia Plants with Capacity – India

Iran

  • Ammonia Capacity (Ktpa) at plant-level by Feedstock Type and Production Process – Iran
  • Ammonia Capacity (Ktpa) at plant-level by Product Type and Unit Type – Iran
  • Count of Ammonia Plants with overall operational capacity – Iran
  • Ammonia Plants by Capacity (Ktpa) and Current Status – Iran
  • Ammonia Plant details (location, region, year of commissioning) – Iran
  • Announced and Upcoming Ammonia Plants with Capacity – Iran

Japan

  • Ammonia Capacity (Ktpa) at plant-level by Feedstock Type and Production Process – Japan
  • Ammonia Capacity (Ktpa) at plant-level by Product Type and Unit Type – Japan
  • Count of Ammonia Plants with overall operational capacity – Japan
  • Ammonia Plants by Capacity (Ktpa) and Current Status – Japan
  • Ammonia Plant details (location, region, year of commissioning) – Japan
  • Announced and Upcoming Ammonia Plants with Capacity – Japan

Nepal

  • Ammonia Capacity (Ktpa) at plant-level by Feedstock Type and Production Process – Nepal
  • Ammonia Capacity (Ktpa) at plant-level by Product Type and Unit Type – Nepal
  • Count of Ammonia Plants with overall operational capacity – Nepal
  • Ammonia Plants by Capacity (Ktpa) and Current Status – Nepal
  • Ammonia Plant details (location, region, year of commissioning) – Nepal
  • Announced and Upcoming Ammonia Plants with Capacity – Nepal

USA

  • Ammonia Capacity (Ktpa) at plant-level by Feedstock Type and Production Process – USA
  • Ammonia Capacity (Ktpa) at plant-level by Product Type and Unit Type – USA
  • Count of Ammonia Plants with overall operational capacity – USA
  • Ammonia Plants by Capacity (Ktpa) and Current Status – USA
  • Ammonia Plant details (location, region, year of commissioning) – USA
  • Announced and Upcoming Ammonia Plants with Capacity – USA

Canada

  • Ammonia Capacity (Ktpa) at plant-level by Feedstock Type and Production Process – Canada
  • Ammonia Capacity (Ktpa) at plant-level by Product Type and Unit Type – Canada
  • Count of Ammonia Plants with overall operational capacity – Canada
  • Ammonia Plants by Capacity (Ktpa) and Current Status – Canada
  • Ammonia Plant details (location, region, year of commissioning) – Canada
  • Announced and Upcoming Ammonia Plants with Capacity – Canada

Egypt

  • Ammonia Capacity (Ktpa) at plant-level by Feedstock Type and Production Process – Egypt
  • Ammonia Capacity (Ktpa) at plant-level by Product Type and Unit Type – Egypt
  • Count of Ammonia Plants with overall operational capacity – Egypt
  • Ammonia Plants by Capacity (Ktpa) and Current Status – Egypt
  • Ammonia Plant details (location, region, year of commissioning) – Egypt
  • Announced and Upcoming Ammonia Plants with Capacity – Egypt

Kuwait

  • Ammonia Capacity (Ktpa) at plant-level by Feedstock Type and Production Process – Kuwait
  • Ammonia Capacity (Ktpa) at plant-level by Product Type and Unit Type – Kuwait
  • Count of Ammonia Plants with overall operational capacity – Kuwait
  • Ammonia Plants by Capacity (Ktpa) and Current Status – Kuwait
  • Ammonia Plant details (location, region, year of commissioning) – Kuwait
  • Announced and Upcoming Ammonia Plants with Capacity – Kuwait

Russia

  • Ammonia Capacity (Ktpa) at plant-level by Feedstock Type and Production Process – Russia
  • Ammonia Capacity (Ktpa) at plant-level by Product Type and Unit Type – Russia
  • Count of Ammonia Plants with overall operational capacity – Russia
  • Ammonia Plants by Capacity (Ktpa) and Current Status – Russia
  • Ammonia Plant details (location, region, year of commissioning) – Russia
  • Announced and Upcoming Ammonia Plants with Capacity – Russia

Germany

  • Ammonia Capacity (Ktpa) at plant-level by Feedstock Type and Production Process – Germany
  • Ammonia Capacity (Ktpa) at plant-level by Product Type and Unit Type – Germany
  • Count of Ammonia Plants with overall operational capacity – Germany
  • Ammonia Plants by Capacity (Ktpa) and Current Status – Germany
  • Ammonia Plant details (location, region, year of commissioning) – Germany
  • Announced and Upcoming Ammonia Plants with Capacity – Germany

UK

  • Ammonia Capacity (Ktpa) at plant-level by Feedstock Type and Production Process – UK
  • Ammonia Capacity (Ktpa) at plant-level by Product Type and Unit Type – UK
  • Count of Ammonia Plants with overall operational capacity – UK
  • Ammonia Plants by Capacity (Ktpa) and Current Status – UK
  • Ammonia Plant details (location, region, year of commissioning) – UK
  • Announced and Upcoming Ammonia Plants with Capacity – UK

Netherlands

  • Ammonia Capacity (Ktpa) at plant-level by Feedstock Type and Production Process – Netherlands
  • Ammonia Capacity (Ktpa) at plant-level by Product Type and Unit Type – Netherlands
  • Count of Ammonia Plants with overall operational capacity – Netherlands
  • Ammonia Plants by Capacity (Ktpa) and Current Status – Netherlands
  • Ammonia Plant details (location, region, year of commissioning) – Netherlands
  • Announced and Upcoming Ammonia Plants with Capacity – Netherlands

Belgium

  • Ammonia Capacity (Ktpa) at plant-level by Feedstock Type and Production Process – Belgium
  • Ammonia Capacity (Ktpa) at plant-level by Product Type and Unit Type – Belgium
  • Count of Ammonia Plants with overall operational capacity – Belgium
  • Ammonia Plants by Capacity (Ktpa) and Current Status – Belgium
  • Ammonia Plant details (location, region, year of commissioning) – Belgium
  • Announced and Upcoming Ammonia Plants with Capacity – Belgium

Italy

  • Ammonia Capacity (Ktpa) at plant-level by Feedstock Type and Production Process – Italy
  • Ammonia Capacity (Ktpa) at plant-level by Product Type and Unit Type – Italy
  • Count of Ammonia Plants with overall operational capacity – Italy
  • Ammonia Plants by Capacity (Ktpa) and Current Status – Italy
  • Ammonia Plant details (location, region, year of commissioning) – Italy
  • Announced and Upcoming Ammonia Plants with Capacity – Italy

France

  • Ammonia Capacity (Ktpa) at plant-level by Feedstock Type and Production Process – France
  • Ammonia Capacity (Ktpa) at plant-level by Product Type and Unit Type – France
  • Count of Ammonia Plants with overall operational capacity – France
  • Ammonia Plants by Capacity (Ktpa) and Current Status – France
  • Ammonia Plant details (location, region, year of commissioning) – France
  • Announced and Upcoming Ammonia Plants with Capacity – France

Spain

  • Ammonia Capacity (Ktpa) at plant-level by Feedstock Type and Production Process – Spain
  • Ammonia Capacity (Ktpa) at plant-level by Product Type and Unit Type – Spain
  • Count of Ammonia Plants with overall operational capacity – Spain
  • Ammonia Plants by Capacity (Ktpa) and Current Status – Spain
  • Ammonia Plant details (location, region, year of commissioning) – Spain
  • Announced and Upcoming Ammonia Plants with Capacity – Spain

Czech Republic

  • Ammonia Capacity (Ktpa) at plant-level by Feedstock Type and Production Process – Czech Republic
  • Ammonia Capacity (Ktpa) at plant-level by Product Type and Unit Type – Czech Republic
  • Count of Ammonia Plants with overall operational capacity – Czech Republic
  • Ammonia Plants by Capacity (Ktpa) and Current Status – Czech Republic
  • Ammonia Plant details (location, region, year of commissioning) – Czech Republic
  • Announced and Upcoming Ammonia Plants with Capacity – Czech Republic

Brazil

  • Ammonia Capacity (Ktpa) at plant-level by Feedstock Type and Production Process – Brazil
  • Ammonia Capacity (Ktpa) at plant-level by Product Type and Unit Type – Brazil
  • Count of Ammonia Plants with overall operational capacity – Brazil
  • Ammonia Plants by Capacity (Ktpa) and Current Status – Brazil
  • Ammonia Plant details (location, region, year of commissioning) – Brazil
  • Announced and Upcoming Ammonia Plants with Capacity – Brazil

Daily Operations Tracker

Regional Tracking

Asia Pacific

  • Total Operational Capacity (Ktpa) at plant level
  • Total Disrupted Capacity (Ktpa) and Production Loss (Kt) at plant level
  • Plant Outage Duration (Start Date and End Date)
  • Disruption Cause and Impact on Price
  • Plant Disruption by disruption type (Permanent or Temporary)

Europe

  • Total Operational Capacity (Ktpa) at plant level
  • Total Disrupted Capacity (Ktpa) and Production Loss (Kt) at plant level
    Plant Outage Duration (Start Date and End Date)
  • Disruption Cause and Impact on Price
  • Plant Disruption by disruption type (Permanent or Temporary)

North America

  • Total Operational Capacity (Ktpa) at plant level
  • Total Disrupted Capacity (Ktpa) and Production Loss (Kt) at plant level
  • Plant Outage Duration (Start Date and End Date)
  • Disruption Cause and Impact on Price
  • Plant Disruption by disruption type (Permanent or Temporary)

Middle East & Africa

  • Total Operational Capacity (Ktpa) at plant level
  • Total Disrupted Capacity (Ktpa) and Production Loss (Kt) at plant level
  • Plant Outage Duration (Start Date and End Date)
  • Disruption Cause and Impact on Price
  • Plant Disruption by disruption type (Permanent or Temporary)

South America

  • Total Operational Capacity (Ktpa) at plant level
  • Total Disrupted Capacity (Ktpa) and Production Loss (Kt) at plant level
  • Plant Outage Duration (Start Date and End Date)
  • Disruption Cause and Impact on Price
  • Plant Disruption by disruption type (Permanent or Temporary)

Country-wise Tracking

China

  • Total Operational Capacity (Ktpa) at plant level
  • Total Disrupted Capacity (Ktpa) and Production Loss (Kt) at plant level
  • Plant Outage Duration (Start Date and End Date)
  • Disruption Cause and Impact on Price
  • Plant Disruption by disruption type (Permanent or Temporary)

India

  • Total Operational Capacity (Ktpa) at plant level
  • Total Disrupted Capacity (Ktpa) and Production Loss (Kt) at plant level
  • Plant Outage Duration (Start Date and End Date)
  • Disruption Cause and Impact on Price
  • Plant Disruption by disruption type (Permanent or Temporary)

Nepal

  • Total Operational Capacity (Ktpa) at plant level
  • Total Disrupted Capacity (Ktpa) and Production Loss (Kt) at plant level
  • Plant Outage Duration (Start Date and End Date)
  • Disruption Cause and Impact on Price
  • Plant Disruption by disruption type (Permanent or Temporary)

Iran

  • Total Operational Capacity (Ktpa) at plant level
  • Total Disrupted Capacity (Ktpa) and Production Loss (Kt) at plant level
  • Plant Outage Duration (Start Date and End Date)
  • Disruption Cause and Impact on Price
  • Plant Disruption by disruption type (Permanent or Temporary)

Japan

  • Total Operational Capacity (Ktpa) at plant level
  • Total Disrupted Capacity (Ktpa) and Production Loss (Kt) at plant level
  • Plant Outage Duration (Start Date and End Date)
  • Disruption Cause and Impact on Price
  • Plant Disruption by disruption type (Permanent or Temporary)

Canada

  • Total Operational Capacity (Ktpa) at plant level
  • Total Disrupted Capacity (Ktpa) and Production Loss (Kt) at plant level
  • Plant Outage Duration (Start Date and End Date)
  • Disruption Cause and Impact on Price
  • Plant Disruption by disruption type (Permanent or Temporary)

USA

  • Total Operational Capacity (Ktpa) at plant level
  • Total Disrupted Capacity (Ktpa) and Production Loss (Kt) at plant level
  • Plant Outage Duration (Start Date and End Date)
  • Disruption Cause and Impact on Price
  • Plant Disruption by disruption type (Permanent or Temporary)

Egypt

  • Total Operational Capacity (Ktpa) at plant level
  • Total Disrupted Capacity (Ktpa) and Production Loss (Kt) at plant level
  • Plant Outage Duration (Start Date and End Date)
  • Disruption Cause and Impact on Price
  • Plant Disruption by disruption type (Permanent or Temporary)

Kuwait

  • Total Operational Capacity (Ktpa) at plant level
  • Total Disrupted Capacity (Ktpa) and Production Loss (Kt) at plant level
  • Plant Outage Duration (Start Date and End Date)
  • Disruption Cause and Impact on Price
  • Plant Disruption by disruption type (Permanent or Temporary)

Belgium

  • Total Operational Capacity (Ktpa) at plant level
  • Total Disrupted Capacity (Ktpa) and Production Loss (Kt) at plant level
  • Plant Outage Duration (Start Date and End Date)
  • Disruption Cause and Impact on Price
  • Plant Disruption by disruption type (Permanent or Temporary)

Czech Republic

  • Total Operational Capacity (Ktpa) at plant level
  • Total Disrupted Capacity (Ktpa) and Production Loss (Kt) at plant level
  • Plant Outage Duration (Start Date and End Date)
  • Disruption Cause and Impact on Price
  • Plant Disruption by disruption type (Permanent or Temporary)

France

  • Total Operational Capacity (Ktpa) at plant level
  • Total Disrupted Capacity (Ktpa) and Production Loss (Kt) at plant level
  • Plant Outage Duration (Start Date and End Date)
  • Disruption Cause and Impact on Price
  • Plant Disruption by disruption type (Permanent or Temporary)

Germany

  • Total Operational Capacity (Ktpa) at plant level
  • Total Disrupted Capacity (Ktpa) and Production Loss (Kt) at plant level
  • Plant Outage Duration (Start Date and End Date)
  • Disruption Cause and Impact on Price
  • Plant Disruption by disruption type (Permanent or Temporary)

Italy

  • Total Operational Capacity (Ktpa) at plant level
  • Total Disrupted Capacity (Ktpa) and Production Loss (Kt) at plant level
  • Plant Outage Duration (Start Date and End Date)
  • Disruption Cause and Impact on Price
  • Plant Disruption by disruption type (Permanent or Temporary)

Netherlands

  • Total Operational Capacity (Ktpa) at plant level
  • Total Disrupted Capacity (Ktpa) and Production Loss (Kt) at plant level
  • Plant Outage Duration (Start Date and End Date)
  • Disruption Cause and Impact on Price
  • Plant Disruption by disruption type (Permanent or Temporary)

Russia

  • Total Operational Capacity (Ktpa) at plant level
  • Total Disrupted Capacity (Ktpa) and Production Loss (Kt) at plant level
  • Plant Outage Duration (Start Date and End Date)
    Disruption Cause and Impact on Price
  • Plant Disruption by disruption type (Permanent or Temporary)

Spain

  • Total Operational Capacity (Ktpa) at plant level
  • Total Disrupted Capacity (Ktpa) and Production Loss (Kt) at plant level
  • Plant Outage Duration (Start Date and End Date)
  • Disruption Cause and Impact on Price
  • Plant Disruption by disruption type (Permanent or Temporary)

UK

  • Total Operational Capacity (Ktpa) at plant level
  • Total Disrupted Capacity (Ktpa) and Production Loss (Kt) at plant level
  • Plant Outage Duration (Start Date and End Date)
  • Disruption Cause and Impact on Price
  • Plant Disruption by disruption type (Permanent or Temporary)

Brazil

  • Total Operational Capacity (Ktpa) at plant level
  • Total Disrupted Capacity (Ktpa) and Production Loss (Kt) at plant level
  • Plant Outage Duration (Start Date and End Date)
  • Disruption Cause and Impact on Price
  • Plant Disruption by disruption type (Permanent or Temporary)

Nigeria

  • Total Operational Capacity (Ktpa) at plant level
  • Total Disrupted Capacity (Ktpa) and Production Loss (Kt) at plant level
  • Plant Outage Duration (Start Date and End Date)
  • Disruption Cause and Impact on Price
  • Plant Disruption by disruption type (Permanent or Temporary)

UAE

  • Total Operational Capacity (Ktpa) at plant level
  • Total Disrupted Capacity (Ktpa) and Production Loss (Kt) at plant level
  • Plant Outage Duration (Start Date and End Date)
  • Disruption Cause and Impact on Price
  • Plant Disruption by disruption type (Permanent or Temporary)

Bahrain

  • Total Operational Capacity (Ktpa) at plant level
  • Total Disrupted Capacity (Ktpa) and Production Loss (Kt) at plant level
  • Plant Outage Duration (Start Date and End Date)
  • Disruption Cause and Impact on Price
  • Plant Disruption by disruption type (Permanent or Temporary)

Iran

  • Total Operational Capacity (Ktpa) at plant level
  • Total Disrupted Capacity (Ktpa) and Production Loss (Kt) at plant level
  • Plant Outage Duration (Start Date and End Date)
  • Disruption Cause and Impact on Price
  • Plant Disruption by disruption type (Permanent or Temporary)

Saudi Arabia

  • Total Operational Capacity (Ktpa) at plant level
  • Total Disrupted Capacity (Ktpa) and Production Loss (Kt) at plant level
  • Plant Outage Duration (Start Date and End Date)
  • Disruption Cause and Impact on Price
  • Plant Disruption by disruption type (Permanent or Temporary)

Libya

  • Total Operational Capacity (Ktpa) at plant level
  • Total Disrupted Capacity (Ktpa) and Production Loss (Kt) at plant level
  • Plant Outage Duration (Start Date and End Date)
  • Disruption Cause and Impact on Price
  • Plant Disruption by disruption type (Permanent or Temporary)

Qatar

  • Total Operational Capacity (Ktpa) at plant level
  • Total Disrupted Capacity (Ktpa) and Production Loss (Kt) at plant level
  • Plant Outage Duration (Start Date and End Date)
  • Disruption Cause and Impact on Price
  • Plant Disruption by disruption type (Permanent or Temporary)

South Africa

  • Total Operational Capacity (Ktpa) at plant level
  • Total Disrupted Capacity (Ktpa) and Production Loss (Kt) at plant level
  • Plant Outage Duration (Start Date and End Date)
  • Disruption Cause and Impact on Price
  • Plant Disruption by disruption type (Permanent or Temporary)

Lithuania

  • Total Operational Capacity (Ktpa) at plant level
  • Total Disrupted Capacity (Ktpa) and Production Loss (Kt) at plant level
  • Plant Outage Duration (Start Date and End Date)
  • Disruption Cause and Impact on Price
  • Plant Disruption by disruption type (Permanent or Temporary)

Russia

  • Total Operational Capacity (Ktpa) at plant level
  • Total Disrupted Capacity (Ktpa) and Production Loss (Kt) at plant level
  • Plant Outage Duration (Start Date and End Date)
  • Disruption Cause and Impact on Price
  • Plant Disruption by disruption type (Permanent or Temporary)

Germany

  • Total Operational Capacity (Ktpa) at plant level
  • Total Disrupted Capacity (Ktpa) and Production Loss (Kt) at plant level
  • Plant Outage Duration (Start Date and End Date)
  • Disruption Cause and Impact on Price
  • Plant Disruption by disruption type (Permanent or Temporary)

UK

  • Total Operational Capacity (Ktpa) at plant level
  • Total Disrupted Capacity (Ktpa) and Production Loss (Kt) at plant level
  • Plant Outage Duration (Start Date and End Date)
  • Disruption Cause and Impact on Price
  • Plant Disruption by disruption type (Permanent or Temporary)

Slovakia

  • Total Operational Capacity (Ktpa) at plant level
  • Total Disrupted Capacity (Ktpa) and Production Loss (Kt) at plant level
  • Plant Outage Duration (Start Date and End Date)
  • Disruption Cause and Impact on Price
  • Plant Disruption by disruption type (Permanent or Temporary)

Poland

  • Total Operational Capacity (Ktpa) at plant level
  • Total Disrupted Capacity (Ktpa) and Production Loss (Kt) at plant level
  • Plant Outage Duration (Start Date and End Date)
  • Disruption Cause and Impact on Price
  • Plant Disruption by disruption type (Permanent or Temporary)

Georgia

  • Total Operational Capacity (Ktpa) at plant level
  • Total Disrupted Capacity (Ktpa) and Production Loss (Kt) at plant level
  • Plant Outage Duration (Start Date and End Date)
  • Disruption Cause and Impact on Price
  • Plant Disruption by disruption type (Permanent or Temporary)

Bulgaria

  • Total Operational Capacity (Ktpa) at plant level
  • Total Disrupted Capacity (Ktpa) and Production Loss (Kt) at plant level
  • Plant Outage Duration (Start Date and End Date)
  • Disruption Cause and Impact on Price
  • Plant Disruption by disruption type (Permanent or Temporary)

Hungary

  • Total Operational Capacity (Ktpa) at plant level
  • Total Disrupted Capacity (Ktpa) and Production Loss (Kt) at plant level
  • Plant Outage Duration (Start Date and End Date)
  • Disruption Cause and Impact on Price
  • Plant Disruption by disruption type (Permanent or Temporary)

Ukraine

  • Total Operational Capacity (Ktpa) at plant level
  • Total Disrupted Capacity (Ktpa) and Production Loss (Kt) at plant level
  • Plant Outage Duration (Start Date and End Date)
  • Disruption Cause and Impact on Price
  • Plant Disruption by disruption type (Permanent or Temporary)

Estonia

  • Total Operational Capacity (Ktpa) at plant level
  • Total Disrupted Capacity (Ktpa) and Production Loss (Kt) at plant level
  • Plant Outage Duration (Start Date and End Date)
  • Disruption Cause and Impact on Price
  • Plant Disruption by disruption type (Permanent or Temporary)

Netherlands

  • Total Operational Capacity (Ktpa) at plant level
  • Total Disrupted Capacity (Ktpa) and Production Loss (Kt) at plant level
  • Plant Outage Duration (Start Date and End Date)
  • Disruption Cause and Impact on Price
  • Plant Disruption by disruption type (Permanent or Temporary)

Norway

  • Total Operational Capacity (Ktpa) at plant level
  • Total Disrupted Capacity (Ktpa) and Production Loss (Kt) at plant level
  • Plant Outage Duration (Start Date and End Date)
  • Disruption Cause and Impact on Price
  • Plant Disruption by disruption type (Permanent or Temporary)

Belgium

  • Total Operational Capacity (Ktpa) at plant level
  • Total Disrupted Capacity (Ktpa) and Production Loss (Kt) at plant level
  • Plant Outage Duration (Start Date and End Date)
  • Disruption Cause and Impact on Price
  • Plant Disruption by disruption type (Permanent or Temporary)

Italy

  • Total Operational Capacity (Ktpa) at plant level
  • Total Disrupted Capacity (Ktpa) and Production Loss (Kt) at plant level
  • Plant Outage Duration (Start Date and End Date)
  • Disruption Cause and Impact on Price
  • Plant Disruption by disruption type (Permanent or Temporary)

France

  • Total Operational Capacity (Ktpa) at plant level
  • Total Disrupted Capacity (Ktpa) and Production Loss (Kt) at plant level
  • Plant Outage Duration (Start Date and End Date)
  • Disruption Cause and Impact on Price
  • Plant Disruption by disruption type (Permanent or Temporary)

Frequently Asked Questions – Ammonia G.I.O Tracker

What is the Ammonia GIO Tracker?

The Ammonia GIO Tracker is an asset-level operational intelligence platform that monitors global ammonia capacity, daily disruptions, production loss, and price impact across major producing regions.

What does the Ammonia GIO Tracker monitor?

It tracks ammonia capacity (Mtpa), production process, feedstock dependency (natural gas/hydrogen), operational status, capacity additions, new plant commissioning, shutdowns, maintenance turnarounds, restarts, outage duration, and quantified production loss at the facility level.

How frequently is the data updated?

Plant-level operational status and disruption signals are updated daily to provide real-time visibility into global Ammonia supply developments.

How is production loss calculated?

Each ammonia disruption is assessed based on affected capacity, outage duration, and operating status to estimate measurable production loss (Mtpa), enabling structured impact analysis.

Does the Ammonia GIO Tracker cover global or regional markets?

It provides global coverage with structured regional and country-level drill-down across Asia-Pacific, Europe, North America, Middle East & Africa and South America.

Who benefits from Ammonia GIO Tracker?

Fertilizer producers, raw material procurement teams, commodity traders, supply chain risk managers, and strategy teams use the platform to anticipate ammonia supply shifts and pricing risks.

How does it differ from country-level Ammonia production reports?

Unlike aggregated national statistics, the Ammonia GIO Tracker monitors individual ammonia facilities, enabling early identification of supply risks before they are reflected in official production data.

Does it provide Ammonia price forecasts?

The Tracker integrates plant-level disruptions with regional tightness indicators and historical ammonia price behaviour to highlight potential price inflection risks, rather than relying solely on backward-looking data.

How does it help manage Ammonia supply risk?

By quantifying production loss, tracking outage duration, and mapping downstream exposure to urea, ammonium nitrate, and fertilizer markets, the platform supports proactive procurement, trading, and strategic planning decisions.

Can I analyse Ammonia alongside other commodities?

Yes. The Ammonia GIO Tracker applies a consistent plant-level intelligence framework that allows users to compare ammonia disruptions, capacity shifts, and supply risks alongside other chemical value chains. Standardized metrics such as capacity (Mtpa), outage duration, and quantified production loss enable cross-commodity risk comparison and identification of ripple effects across the fertilizer and industrial ecosystem.

Get Full Access to Ammonia Intelligence Subscribe to unlock facility-level data, daily disruption alerts and full G.I.O Tracker coverage.

UPGRADE NOW