Ethanol G.I.O Tracker: Plant-Level Capacity and Daily Disruption Tracking & Impact Assessment Since 2015

Overview

The global Ethanol market is shaped by a concentrated production base, capital-intensive assets, and supply chains that transmit disruptions far beyond the facility.

GIO Tracker delivers daily asset-level intelligence on Ethanol plants covering capacity, production process, feedstock dependency, operational status, and outage history across all major producing regions. From fermentation/distillation utilization rates to total production loss by cause, every data point is captured at the facility level and updated every day. Access the operational intelligence, disruption signals, and pricing impact data needed to stay ahead of supply shifts before they reach the market.

10++ Countries
250++ Production Facilities
200++ Operating Companies
90+ MMTPA Annual Capacity Tracked

Ethanol Downstream Impact Mapping

Ethanol stands at the core of essential industrial processes, serving as the foundational input for fuel blending, beverage production, and chemicals that underpin transportation, food & beverage, and specialty applications. As the primary alcohol source via fermentation/distillation processes, Ethanol directly drives biofuel ethanol, distilled spirits, ethyl acetate, and solvent production, shaping cost structures and supply availability across refineries, distilleries, and chemical sectors.

Its production is inherently capital-intensive and operationally rigid, meaning capacity losses at the Ethanol stage are rarely absorbed quickly and propagate through derivative chains with outsized force. Supply disruptions at this foundational level cascade rapidly across fuel blending, beverage fermentation, and chemical synthesis, reshaping trade flows, inflating input costs for biofuel lines and distilleries, and tightening regional availability in ways that persist well beyond the initial outage.

Strategic Visibility – Ethanol G.I.O Tracker

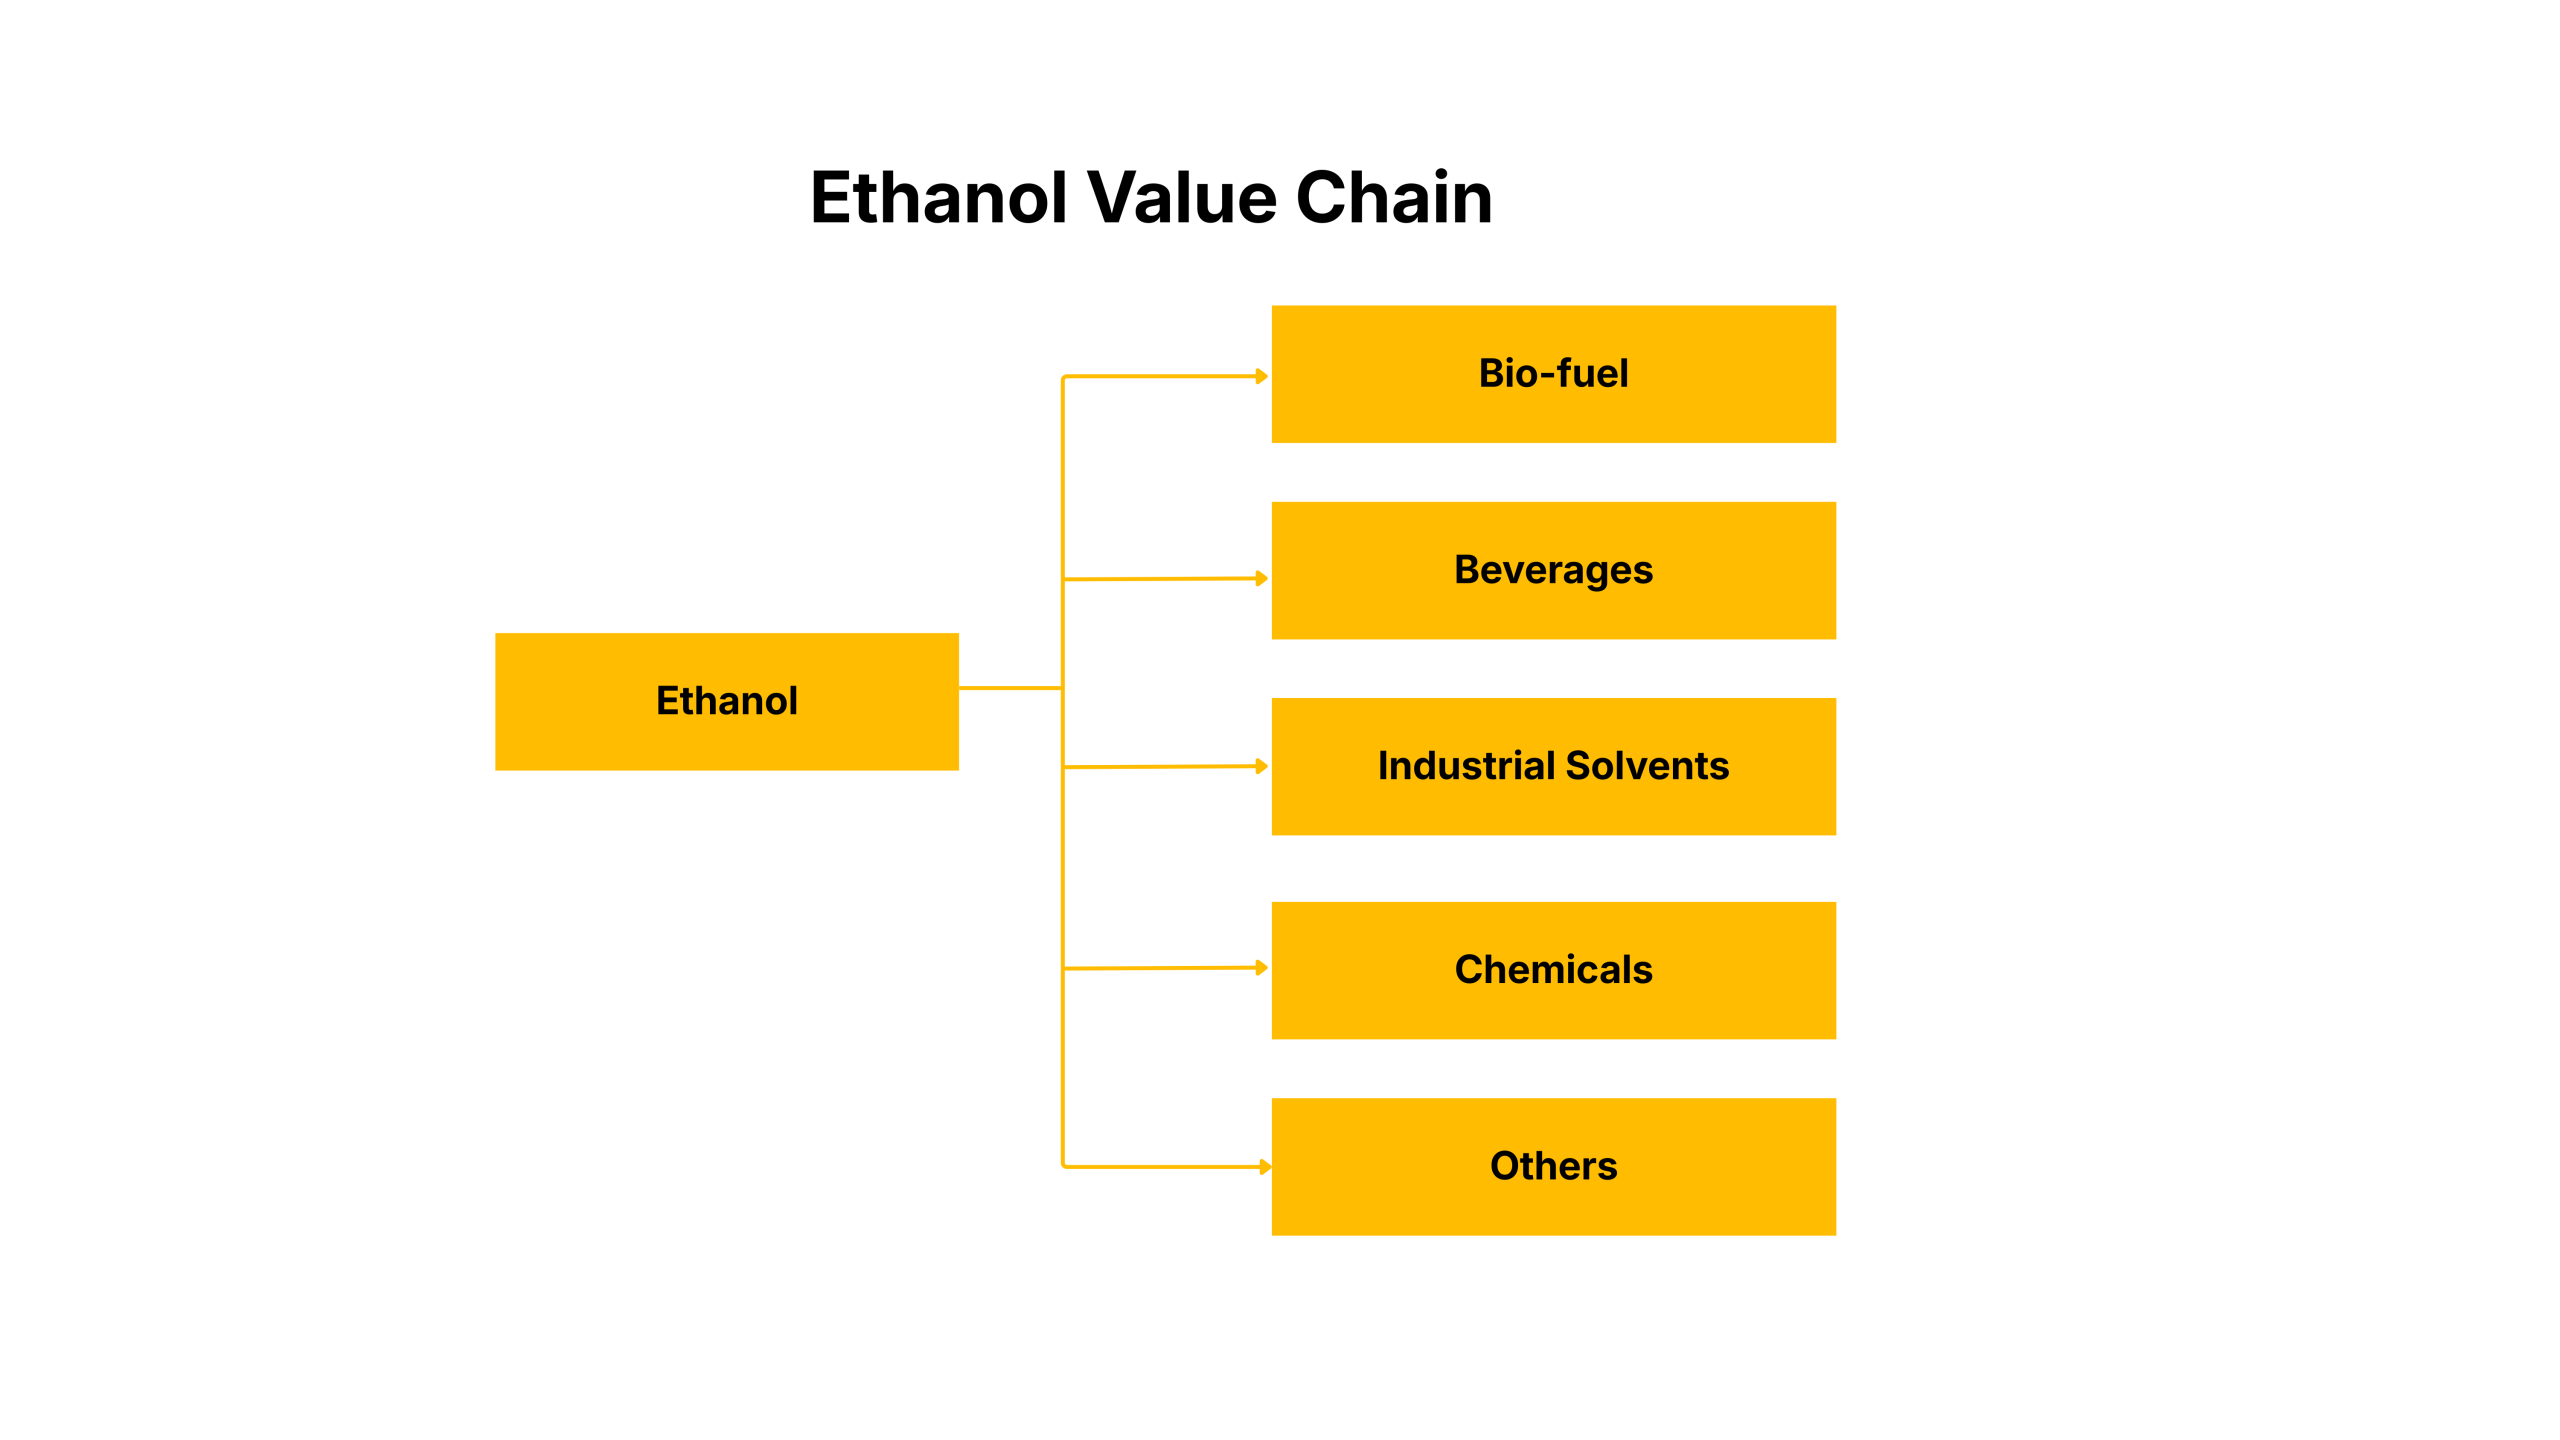
Ethanol supply is concentrated, capital-intensive, and slow to replace. When capacity goes offline, price reactions are nonlinear. Get GIO Tracker for early warning on nonlinear ethanol supply shocks across fuel blending, beverage, and chemical value chains.

Put GIO Tracker to work across your portfolio to surface those stress points early, quantify at plant level how outages will ripple through refineries, fuel blenders, distilleries, and key end‑use sectors, and turn hidden operational risk into visible, actionable signals before it cascades across the downstream value chain

Price Watch™ Ethanol G.I.O Tracker Coverage

Global Overview

Global Ethanol production reached 80+ million tons in 2025,
concentrated in corn and sugarcane based regions like North America (USA: 55+ Mtpa), South America (Brazil: 14+ Mtpa), Asia (China: 6+ Mtpa, India: 2+ Mtpa) and Europe: 3+ Mtpa. The Global Ethanol GIO Tracker delivers plant level operational intelligence across major ethanol producing regions. Built on tracking since 2015, it monitors 250+ facilities worldwide, combining capacity, feedstock mix, utilization, and real time disruption signals to reveal supply flashpoints in concentrated ethanol markets that drive global fuel blending, beverage, and chemical value chains.

Asia Pacific Ethanol Plant Tracking

Tracks 50+ plants across the region, including major corn, sugarcane, and molasses based facilities in key agro industrial clusters. Monitors monsoon disruptions, feedstock price spikes, and policy driven biofuel mandates that tighten regional and global ethanol flows.

  • China Ethanol Plant Tracking: Covers 25+ facilities representing around 6% of global capacity (6+ Mtpa), delivering daily intelligence on corn availability constraints, winter curtailments, and policy driven biofuel rollouts that signal national supply shifts impacting domestic fuel blending, beverage, and solvent markets.
  • India Ethanol Plant Tracking: Monitors 15+ plants representing 2+ Mtpa, providing real time updates on sugarcane harvest cycles, monsoon linked crushing delays, and government driven ethanol blending programs that support India’s fuel self sufficiency and agricultural income targets.

North America Ethanol Plant Tracking

Monitors 200+ plants and provides integrated visibility on major corn based ethanol plants across the region. Tracks turnarounds, energy outages, and capacity shifts amid growing fuel blending and export demand, identifying tightness before regional prices react.

  • U.S. Ethanol Plant Tracking: Monitors 190+ facilities representing over 60% of global capacity (55+ Mtpa), capturing daily restarts after maintenance, hurricane linked outages, and corn harvest driven capacity swings as domestic fuel blending, beverage, and industrial chemical demand accelerates.

Europe Ethanol Plant Tracking

Monitors 10+ plants and provides integrated visibility on major ethanol plants across the region. Tracks turnarounds, energy outages, and capacity shifts amid growing fuel blending and export demand, identifying tightness before regional prices react.

  • Netherlands Ethanol Plant Tracking: Monitors 2 facilities representing over 0.5+ Mtpa, capturing daily restarts after maintenance, hurricane linked outages, and corn harvest driven capacity swings as domestic fuel blending, beverage, and industrial chemical demand accelerates.

South America Ethanol Plant Tracking

Tracks 30+ plants amid rising fuel ethanol and export demand in key Latin American agro industrial hubs. Monitors drought linked cane shortages, currency fluctuations, and policy driven biofuel expansions across sugarcane and corn based complexes.

  • Brazil Ethanol Plant Tracking: Monitors 30+ plants representing around 20% of global capacity (15+ Mtpa total), providing updates on sugarcane crush cycles, weather driven cane shortfalls, and domestic fuel mandate expansions that shape global ethanol trade flows.

Why Ethanol G.I.O Tracker

Ethanol G.I.O Tracker – Comprehensive Market Coverage & Intelligence Dashboard

Asset-Level Facility Intelligence

Regional Coverage

Asia Pacific

  • Ethanol Capacity (Ktpa) at plant-level by Feedstock Type and Production Process – Asia Pacific
  • Ethanol Capacity (Ktpa) at plant-level by Product Type and Unit Type – Asia Pacific
  • Count of Ethanol Plants with overall operational capacity – Asia Pacific
  • Ethanol Plants by Capacity (Ktpa) and Current Status – Asia Pacific
  • Ethanol Plant details (location, region, year of commissioning) –Asia Pacific
  • Announced and Upcoming Ethanol Plants with Capacity – Asia Pacific

Europe

  • Ethanol Capacity (Ktpa) at plant-level by Feedstock Type and Production Process – Europe
  • Ethanol Capacity (Ktpa) at plant-level by Product Type and Unit Type – Europe
  • Count of Ethanol Plants with overall operational capacity – Europe
  • Ethanol Plants by Capacity (Ktpa) and Current Status – Europe
  • Ethanol Plant details (location, region, year of commissioning) –Europe
  • Announced and Upcoming Ethanol Plants with Capacity – Europe

North America

  • Ethanol Capacity (Ktpa) at plant-level by Feedstock Type and
  • Production Process – North America
  • Ethanol Capacity (Ktpa) at plant-level by Product Type and Unit Type – North America
  • Count of Ethanol Plants with overall operational capacity – North America
  • Ethanol Plants by Capacity (Ktpa) and Current Status – North America
  • Ethanol Plant details (location, region, year of commissioning) – North America
  • Announced and Upcoming Ethanol Plants with Capacity – North America
  • South America
  • Ethanol Capacity (Ktpa) at plant-level by Feedstock Type and Production Process – South America
  • Ethanol Capacity (Ktpa) at plant-level by Product Type and Unit Type – South America
  • Count of Ethanol Plants with overall operational capacity – South America
  • Ethanol Plants by Capacity (Ktpa) and Current Status – South America
  • Ethanol Plant details (location, region, year of commissioning) – South America
  • Announced and Upcoming Ethanol Plants with Capacity – South America

Country-Level Coverage

China

  • Ethanol Capacity (Ktpa) at plant-level by Feedstock Type and Production Process – China
  • Ethanol Capacity (Ktpa) at plant-level by Product Type and Unit Type – China
  • Count of Ethanol Plants with overall operational capacity – China
  • Ethanol Plants by Capacity (Ktpa) and Current Status – China
  • Ethanol Plant details (location, region, year of commissioning) –
    China
  • Announced and Upcoming Ethanol Plants with Capacity – China

India

  • Ethanol Capacity (Ktpa) at plant-level by Feedstock Type and Production Process – India
  • Ethanol Capacity (Ktpa) at plant-level by Product Type and Unit Type – India
  • Count of Ethanol Plants with overall operational capacity – India
  • Ethanol Plants by Capacity (Ktpa) and Current Status – India
  • Ethanol Plant details (location, region, year of commissioning) –
    India
  • Announced and Upcoming Ethanol Plants with Capacity – India

Thailand

  • Ethanol Capacity (Ktpa) at plant-level by Feedstock Type and Production Process – Thailand
  • Ethanol Capacity (Ktpa) at plant-level by Product Type and Unit Type – Thailand
  • Count of Ethanol Plants with overall operational capacity – Thailand
  • Ethanol Plants by Capacity (Ktpa) and Current Status – Thailand
  • Ethanol Plant details (location, region, year of commissioning) –
    Thailand
  • Announced and Upcoming Ethanol Plants with Capacity – Thailand

USA

  • Ethanol Capacity (Ktpa) at plant-level by Feedstock Type and Production Process – USA
  • Ethanol Capacity (Ktpa) at plant-level by Product Type and Unit Type – USA
  • Count of Ethanol Plants with overall operational capacity – USA
  • Ethanol Plants by Capacity (Ktpa) and Current Status – USA
  • Ethanol Plant details (location, region, year of commissioning) – USA
  • Announced and Upcoming Ethanol Plants with Capacity – USA

Germany

  • Ethanol Capacity (Ktpa) at plant-level by Feedstock Type and Production Process – Germany
  • Ethanol Capacity (Ktpa) at plant-level by Product Type and Unit Type – Germany
  • Count of Ethanol Plants with overall operational capacity – Germany
  • Ethanol Plants by Capacity (Ktpa) and Current Status – Germany
  • Ethanol Plant details (location, region, year of commissioning) – Germany
  • Announced and Upcoming Ethanol Plants with Capacity – Germany

UK

  • Ethanol Capacity (Ktpa) at plant-level by Feedstock Type and Production Process – UK
  • Ethanol Capacity (Ktpa) at plant-level by Product Type and Unit Type – UK
  • Count of Ethanol Plants with overall operational capacity – UK
  • Ethanol Plants by Capacity (Ktpa) and Current Status – UK
  • Ethanol Plant details (location, region, year of commissioning) – UK
  • Announced and Upcoming Ethanol Plants with Capacity – UK

Hungary

  • Ethanol Capacity (Ktpa) at plant-level by Feedstock Type and Production Process – Hungary
  • Ethanol Capacity (Ktpa) at plant-level by Product Type and Unit Type – Hungary
  • Count of Ethanol Plants with overall operational capacity – Hungary
  • Ethanol Plants by Capacity (Ktpa) and Current Status – Hungary
  • Ethanol Plant details (location, region, year of commissioning) – Hungary
  • Announced and Upcoming Ethanol Plants with Capacity – Hungary

Netherlands

  • Ethanol Capacity (Ktpa) at plant-level by Feedstock Type and Production Process – Netherlands
  • Ethanol Capacity (Ktpa) at plant-level by Product Type and Unit Type – Netherlands
  • Count of Ethanol Plants with overall operational capacity – Netherlands
  • Ethanol Plants by Capacity (Ktpa) and Current Status – Netherlands
  • Ethanol Plant details (location, region, year of commissioning) – Netherlands
  • Announced and Upcoming Ethanol Plants with Capacity – Netherlands

Belgium

  • Ethanol Capacity (Ktpa) at plant-level by Feedstock Type and Production Process – Belgium
  • Ethanol Capacity (Ktpa) at plant-level by Product Type and Unit Type – Belgium
  • Count of Ethanol Plants with overall operational capacity – Belgium
  • Ethanol Plants by Capacity (Ktpa) and Current Status – Belgium
  • Ethanol Plant details (location, region, year of commissioning) – Belgium
  • Announced and Upcoming Ethanol Plants with Capacity – Belgium

France

  • Ethanol Capacity (Ktpa) at plant-level by Feedstock Type and Production Process – France
  • Ethanol Capacity (Ktpa) at plant-level by Product Type and Unit Type – France
  • Count of Ethanol Plants with overall operational capacity – France
  • Ethanol Plants by Capacity (Ktpa) and Current Status – France
  • Ethanol Plant details (location, region, year of commissioning) – France
  • Announced and Upcoming Ethanol Plants with Capacity – France

Brazil

  • Ethanol Capacity (Ktpa) at plant-level by Feedstock Type and Production Process – Brazil
  • Ethanol Capacity (Ktpa) at plant-level by Product Type and Unit Type – Brazil
  • Count of Ethanol Plants with overall operational capacity – Brazil
  • Ethanol Plants by Capacity (Ktpa) and Current Status – Brazil
  • Ethanol Plant details (location, region, year of commissioning) – Brazil
  • Announced and Upcoming Ethanol Plants with Capacity – Brazil

Daily Operations Tracker

Regional Tracking

Asia Pacific

  • Total Operational Capacity (Ktpa) at plant level
  • Total Disrupted Capacity (Ktpa) and Production Loss (Kt) at plant level
  • Plant Outage Duration (Start Date and End Date)
  • Disruption Cause and Impact on Price
  • Plant Disruption by disruption type (Permanent or Temporary)

Europe

  • Total Operational Capacity (Ktpa) at plant level
  • Total Disrupted Capacity (Ktpa) and Production Loss (Kt) at plant level
  • Plant Outage Duration (Start Date and End Date)
  • Disruption Cause and Impact on Price
  • Plant Disruption by disruption type (Permanent or Temporary)

North America

  • Total Operational Capacity (Ktpa) at plant level
  • Total Disrupted Capacity (Ktpa) and Production Loss (Kt) at plant level
  • Plant Outage Duration (Start Date and End Date)
  • Disruption Cause and Impact on Price
  • Plant Disruption by disruption type (Permanent or Temporary)

South America

  • Total Operational Capacity (Ktpa) at plant level
  • Total Disrupted Capacity (Ktpa) and Production Loss (Kt) at plant level
  • Plant Outage Duration (Start Date and End Date)
  • Disruption Cause and Impact on Price
  • Plant Disruption by disruption type (Permanent or Temporary)

Country-wise Tracking

China

  • Total Operational Capacity (Ktpa) at plant level
  • Total Disrupted Capacity (Ktpa) and Production Loss (Kt) at plant level
  • Plant Outage Duration (Start Date and End Date)
  • Disruption Cause and Impact on Price
  • Plant Disruption by disruption type (Permanent or Temporary)

India

  • Total Operational Capacity (Ktpa) at plant level
  • Total Disrupted Capacity (Ktpa) and Production Loss (Kt) at plant level
  • Plant Outage Duration (Start Date and End Date)
  • Disruption Cause and Impact on Price
  • Plant Disruption by disruption type (Permanent or Temporary)

Thailand

  • Total Operational Capacity (Ktpa) at plant level
  • Total Disrupted Capacity (Ktpa) and Production Loss (Kt) at plant level
  • Plant Outage Duration (Start Date and End Date)
  • Disruption Cause and Impact on Price
  • Plant Disruption by disruption type (Permanent or Temporary)

USA

  • Total Operational Capacity (Ktpa) at plant level
  • Total Disrupted Capacity (Ktpa) and Production Loss (Kt) at plant level
  • Plant Outage Duration (Start Date and End Date)
  • Disruption Cause and Impact on Price
  • Plant Disruption by disruption type (Permanent or Temporary)

Netherlands

  • Total Operational Capacity (Ktpa) at plant level
  • Total Disrupted Capacity (Ktpa) and Production Loss (Kt) at plant level
  • Plant Outage Duration (Start Date and End Date)
  • Disruption Cause and Impact on Price
  • Plant Disruption by disruption type (Permanent or Temporary)

Germany

  • Total Operational Capacity (Ktpa) at plant level
  • Total Disrupted Capacity (Ktpa) and Production Loss (Kt) at plant level
  • Plant Outage Duration (Start Date and End Date)
  • Disruption Cause and Impact on Price
  • Plant Disruption by disruption type (Permanent or Temporary)

UK

  • Total Operational Capacity (Ktpa) at plant level
  • Total Disrupted Capacity (Ktpa) and Production Loss (Kt) at plant level
  • Plant Outage Duration (Start Date and End Date)
  • Disruption Cause and Impact on Price
  • Plant Disruption by disruption type (Permanent or Temporary)

Belgium

  • Total Operational Capacity (Ktpa) at plant level
  • Total Disrupted Capacity (Ktpa) and Production Loss (Kt) at plant level
  • Plant Outage Duration (Start Date and End Date)
  • Disruption Cause and Impact on Price
  • Plant Disruption by disruption type (Permanent or Temporary)

France

  • Total Operational Capacity (Ktpa) at plant level
  • Total Disrupted Capacity (Ktpa) and Production Loss (Kt) at plant level
  • Plant Outage Duration (Start Date and End Date)
  • Disruption Cause and Impact on Price
  • Plant Disruption by disruption type (Permanent or Temporary)

Hungary

  • Total Operational Capacity (Ktpa) at plant level
  • Total Disrupted Capacity (Ktpa) and Production Loss (Kt) at plant level
  • Plant Outage Duration (Start Date and End Date)
  • Disruption Cause and Impact on Price
  • Plant Disruption by disruption type (Permanent or Temporary)

Brazil

  • Total Operational Capacity (Ktpa) at plant level
  • Total Disrupted Capacity (Ktpa) and Production Loss (Kt) at plant level
  • Plant Outage Duration (Start Date and End Date)
  • Disruption Cause and Impact on Price
  • Plant Disruption by disruption type (Permanent or Temporary)

Frequently Asked Questions – Ethanol G.I.O Tracker

What is the Ethanol GIO Tracker?

The Ethanol GIO Tracker is an asset level operational intelligence platform that monitors global ethanol capacity, daily disruptions, production loss, and price impact across major producing regions.

What does the Ethanol GIO Tracker monitor?

It tracks ethanol capacity (Mtpa), production process (fermentation/distillation), feedstock mix (corn, sugarcane, molasses, wheat, beet), operational status, capacity additions, new plant commissioning, shutdowns, maintenance turnarounds, restarts, outage duration, and quantified production loss at the facility level.

How frequently is the data updated?

Plant level operational status and disruption signals are updated daily to provide real time visibility into global ethanol supply developments.

How is production loss calculated?

Each ethanol disruption is assessed based on affected capacity, outage duration, and operating status to estimate measurable production loss (Mtpa), enabling structured impact analysis across fuel, beverage, and industrial chemical chains.

Does the Ethanol GIO Tracker cover global or regional markets?

It provides global coverage with structured regional and country level drill down across Asia Pacific, Europe, North America and South America.

Who benefits from Ethanol GIO Tracker?

Fuel blenders, biofuel refiners, beverage producers, chemical manufacturers, raw material procurement teams, commodity traders, supply chain risk managers, and strategy teams use the platform to anticipate ethanol supply shifts and pricing risks.

How does it differ from country-level Ethanol production reports?

Unlike aggregated national statistics, the Ethanol GIO Tracker monitors individual ethanol plants, enabling early identification of supply risks before they are reflected in official production data.

Does it provide Ethanol price forecasts?

The Tracker integrates plant level disruptions with regional tightness indicators and historical ethanol price behaviour to highlight potential price inflection risks, rather than relying solely on backward looking data.

How does it help manage Ethanol supply risk?

By quantifying production loss, tracking outage duration, and mapping downstream exposure to fuel blending, beverage, and chemical markets, the platform supports proactive procurement, trading, and strategic planning decisions.

Can I analyse Ethanol alongside other commodities?

Yes. The Ethanol GIO Tracker applies a consistent plant level intelligence framework that allows users to compare ethanol disruptions, capacity shifts, and supply risks alongside other agricultural and chemical value chains. Standardized metrics such as capacity (Mtpa), outage duration, and quantified production loss enable cross commodity risk comparison and identification of ripple effects across the fuel, beverage, and chemical ecosystem.

Get Full Access to Ethanol Intelligence Subscribe to unlock facility-level data, daily disruption alerts and full G.I.O Tracker coverage.

UPGRADE NOW
Monitor Daily Ethanol Output & Capacity Status