Isopropyl Alcohol (IPA) G.I.O Tracker: Plant-Level Capacity and Daily Disruption Tracking & Impact Assessment Since 2015

Overview

The global Isopropyl Alcohol (IPA) market is shaped by a concentrated production base, capital-intensive assets, and supply chains that transmit disruptions far beyond the facility.

GIO Tracker delivers daily asset-level intelligence on IPA plants covering capacity, production process, feedstock dependency, operational status, and outage history across all major producing regions. Access the operational intelligence, disruption signals, and pricing impact data needed to stay ahead of supply shifts before they reach the market.

5+ Countries
15+ Production Facilities
5+ Operating Companies
2.5+ MMTPA Annual Capacity Tracked

Isopropyl Alcohol (IPA) Downstream Impact Mapping

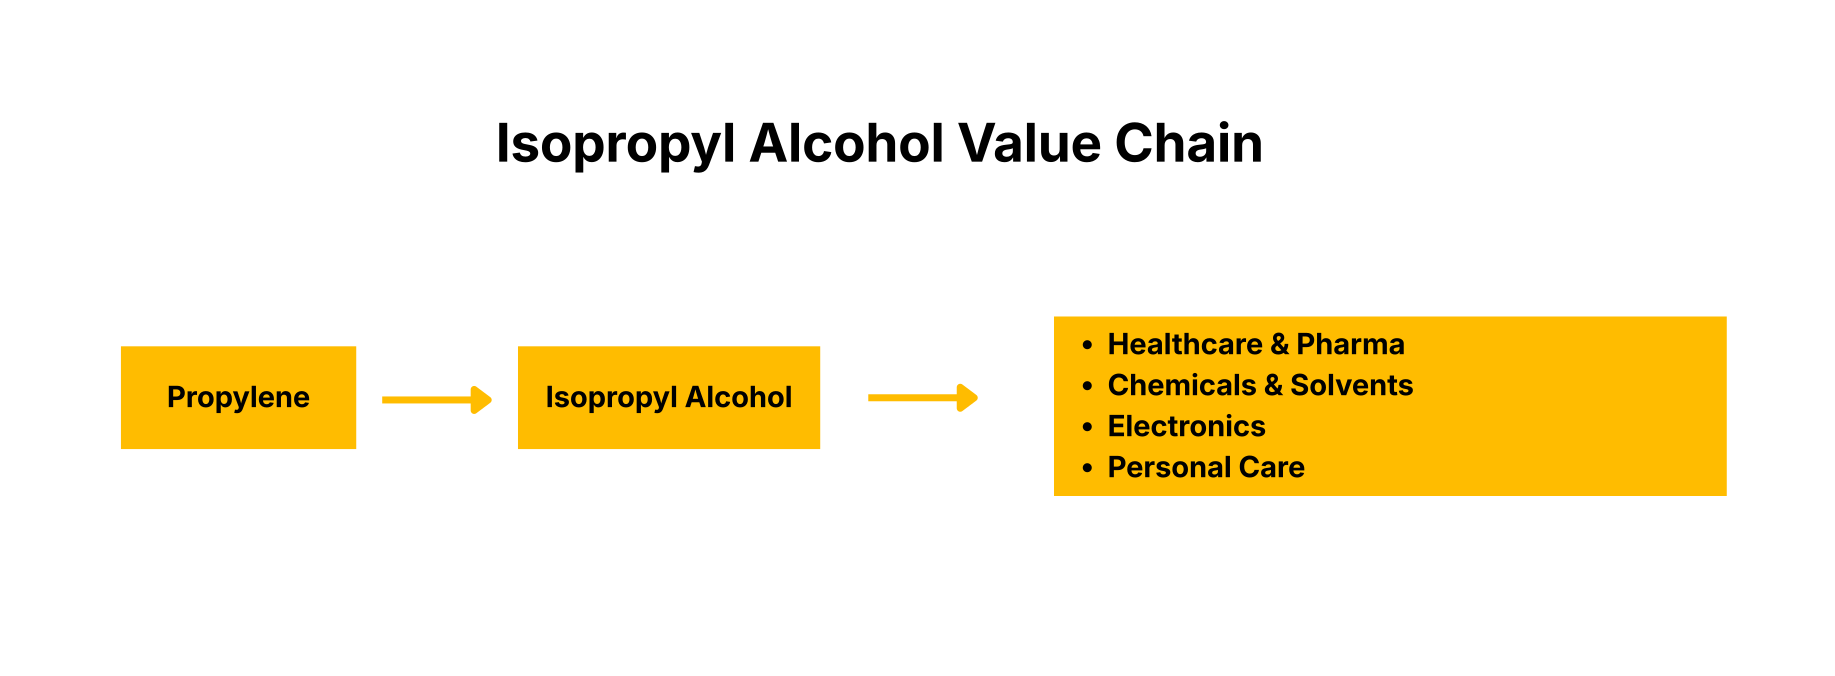
Isopropyl Alcohol (IPA) stands at the core of essential industrial processes, serving as the foundational input for pharmaceuticals, semiconductors, cleaning agents, and chemicals that underpin healthcare, electronics, and consumer products. As the primary solvent and disinfectant via acetone/propylene hydration processes, IPA directly drives antiseptics, electronic-grade cleaners, paints/coatings, and cosmetics, shaping cost structures and supply availability across medical supplies, high-tech manufacturing, and personal care sectors.

Its production is inherently capital-intensive and operationally rigid, meaning capacity losses at the IPA stage are rarely absorbed quickly and propagate through derivative chains with outsized force. Supply disruptions at this foundational level cascade rapidly across pharma formulation, chip fabrication, solvent blending, and disinfectant production, reshaping trade flows, inflating input costs for cleanroom operations and drug manufacturers, and tightening regional availability in ways that persist well beyond the initial outage.

Isopropyl Alcohol

Strategic Visibility – Isopropyl Alcohol (IPA) G.I.O Tracker

IPA supply is concentrated, capital-intensive, and slow to replace. When capacity goes offline, price reactions are nonlinear. Get GIO Tracker for early warning on nonlinear IPA supply shocks across the solvent and chemical value chain.

Put GIO Tracker to work across your portfolio to surface those stress points early, quantify at plant-level how outages will ripple through pharmaceuticals, electronics, cleaning agents, and key end-use sectors, and turn hidden operational risk into visible, actionable signals before it cascades across the downstream value chain.

Price Watch™ Isopropyl Alcohol (IPA) G.I.O Tracker Coverage

Global Overview

Global IPA production reached around 2+ million tons in 2025, concentrated in propylene/acetone-dominant regions like Asia (China: 0.5+ Mtpa), North America (USA: 0.5+ Mtpa) and Europe (0.4+ Mtpa). GIO Tracker provides plant-level visibility across 15+ facilities, tracking capacity shifts and disruptions to forecast supply risks amid steady capacity growth and vulnerability to outages.
The Global IPA GIO Tracker delivers structured, plant-level operational intelligence across major producing regions. Built on historical tracking since 2015, it monitors 15+ facilities worldwide, combining capacity, utilization, and real-time disruption signals to reveal supply flashpoints in concentrated IPA markets that drive global pharmaceuticals, electronics, and solvents.

Asia Pacific IPA Plant Tracking

Tracks 10+ plants across the region, including major trona/solvay complexes in key industrial clusters. Monitors environmental shutdowns, power rationing, and water scarcity risks that tighten regional and global IPA flows.

  • China IPA Plant Tracking: Covers 5+ facilities representing around 20% of global capacity (0.5+ Mtpa), delivering daily intelligence on winter curtailments, flood outages, and policy-driven capacity adjustments that signal national supply shifts impacting global glass and detergent markets.

North America IPA Plant Tracking

Tracks 3+ facilities and provides integrated visibility on major propylene hydration and acetone hydrogenation units across the U.S. and Canada. Tracks turnarounds, energy outages, and capacity shifts amid pharmaceutical and electronics demand, identifying tightness before regional prices react.

  • U.S. IPA Plant Tracking: Monitors 2+ facilities representing around 20% of global capacity (0.5+ Mtpa), capturing daily restarts, labor disruptions, and efficiency upgrades as domestic pharma, cleaning, and semiconductor output from IPA feedstocks accelerates.

Europe IPA Plant Tracking

Tracks 2+ plants under intensifying energy transition pressures across major European chemical hubs. Issues real-time alerts on natural gas shortages, carbon compliance shutdowns, and propylene hydration process optimizations that materially tighten IPA supply flows.

  • Germany IPA Plant Tracking: Monitors 2+ facilities representing around 8% of global capacity (0.2+ Mtpa), providing early warning on energy-driven curtailments, emissions-compliance shutdowns, and process conversions that reshape regional glass and detergent supply.

Why Isopropyl Alcohol (IPA) G.I.O Tracker

Isopropyl Alcohol (IPA) G.I.O Tracker – Comprehensive Market Coverage & Intelligence Dashboard

Asset-Level Facility Intelligence

Regional Coverage

Asia Pacific

  • IPA Capacity (Ktpa) at plant-level by Feedstock Type and Production Process – Asia Pacific
  • IPA Capacity (Ktpa) at plant-level by Product Type and Unit Type – Asia Pacific
  • Count of IPA Plants with overall operational capacity – Asia Pacific
  • IPA Plants by Capacity (Ktpa) and Current Status – Asia Pacific
  • IPA Plant details (location, region, year of commissioning) – Asia Pacific
  • Announced and Upcoming IPA Plants with Capacity – Asia Pacific

Europe

  • IPA Capacity (Ktpa) at plant-level by Feedstock Type and Production Process – Europe
  • IPA Capacity (Ktpa) at plant-level by Product Type and Unit Type – Europe
  • Count of IPA Plants with overall operational capacity – Europe
  • IPA Plants by Capacity (Ktpa) and Current Status – Europe
  • IPA Plant details (location, region, year of commissioning) – Europe
  • Announced and Upcoming IPA Plants with Capacity – Europe

North America

  • IPA Capacity (Ktpa) at plant-level by Feedstock Type and Production Process – North America
  • IPA Capacity (Ktpa) at plant-level by Product Type and Unit Type – North America
  • Count of IPA Plants with overall operational capacity – North America
  • IPA Plants by Capacity (Ktpa) and Current Status – North America
  • IPA Plant details (location, region, year of commissioning) – North America
  • Announced and Upcoming IPA Plants with Capacity – North America

South America

  • IPA Capacity (Ktpa) at plant-level by Feedstock Type and Production Process – South America
  • IPA Capacity (Ktpa) at plant-level by Product Type and Unit Type – South America
  • Count of IPA Plants with overall operational capacity – South America
  • IPA Plants by Capacity (Ktpa) and Current Status – South America
  • IPA Plant details (location, region, year of commissioning) – South America
  • Announced and Upcoming IPA Plants with Capacity – South America

Country-Level Coverage

China

  • IPA Capacity (Ktpa) at plant-level by Feedstock Type and Production Process – China
  • IPA Capacity (Ktpa) at plant-level by Product Type and Unit Type – China
  • Count of IPA Plants with overall operational capacity – China
  • IPA Plants by Capacity (Ktpa) and Current Status – China
  • IPA Plant details (location, region, year of commissioning) – China
  • Announced and Upcoming IPA Plants with Capacity – China

India

  • IPA Capacity (Ktpa) at plant-level by Feedstock Type and Production Process – India
  • IPA Capacity (Ktpa) at plant-level by Product Type and Unit Type – India
  • Count of IPA Plants with overall operational capacity – India
  • IPA Plants by Capacity (Ktpa) and Current Status – India
  • IPA Plant details (location, region, year of commissioning) – India
  • Announced and Upcoming IPA Plants with Capacity – India

Japan

  • IPA Capacity (Ktpa) at plant-level by Feedstock Type and Production Process – Japan
  • IPA Capacity (Ktpa) at plant-level by Product Type and Unit Type – Japan
  • Count of IPA Plants with overall operational capacity – Japan
  • IPA Plants by Capacity (Ktpa) and Current Status – Japan
  • IPA Plant details (location, region, year of commissioning) – Japan
  • Announced and Upcoming IPA Plants with Capacity – Japan

Singapore

  • IPA Capacity (Ktpa) at plant-level by Feedstock Type and Production Process – Singapore
  • IPA Capacity (Ktpa) at plant-level by Product Type and Unit Type – Singapore
  • Count of IPA Plants with overall operational capacity – Singapore
  • IPA Plants by Capacity (Ktpa) and Current Status – Singapore
  • IPA Plant details (location, region, year of commissioning) – Singapore
  • Announced and Upcoming IPA Plants with Capacity – Singapore

South Korea

  • IPA Capacity (Ktpa) at plant-level by Feedstock Type and Production Process – South Korea
  • IPA Capacity (Ktpa) at plant-level by Product Type and Unit Type – South Korea
  • Count of IPA Plants with overall operational capacity – South Korea
  • IPA Plants by Capacity (Ktpa) and Current Status – South Korea
  • IPA Plant details (location, region, year of commissioning) – South Korea
  • Announced and Upcoming IPA Plants with Capacity – South Korea

Taiwan

  • IPA Capacity (Ktpa) at plant-level by Feedstock Type and Production Process – Taiwan
  • IPA Capacity (Ktpa) at plant-level by Product Type and Unit Type – Taiwan
  • Count of IPA Plants with overall operational capacity – Taiwan
  • IPA Plants by Capacity (Ktpa) and Current Status – Taiwan
  • IPA Plant details (location, region, year of commissioning) – Taiwan
  • Announced and Upcoming IPA Plants with Capacity – Taiwan

USA

  • IPA Capacity (Ktpa) at plant-level by Feedstock Type and Production Process – USA
  • IPA Capacity (Ktpa) at plant-level by Product Type and Unit Type – USA
  • Count of IPA Plants with overall operational capacity – USA
  • IPA Plants by Capacity (Ktpa) and Current Status – USA
  • IPA Plant details (location, region, year of commissioning) – USA
  • Announced and Upcoming IPA Plants with Capacity – USA

Canada

  • IPA Capacity (Ktpa) at plant-level by Feedstock Type and Production Process – Canada
  • IPA Capacity (Ktpa) at plant-level by Product Type and Unit Type – Canada
  • Count of IPA Plants with overall operational capacity – Canada
  • IPA Plants by Capacity (Ktpa) and Current Status – Canada
  • IPA Plant details (location, region, year of commissioning) – Canada
  • Announced and Upcoming IPA Plants with Capacity – Canada

France

  • IPA Capacity (Ktpa) at plant-level by Feedstock Type and Production Process – France
  • IPA Capacity (Ktpa) at plant-level by Product Type and Unit Type – France
  • Count of IPA Plants with overall operational capacity – France
  • IPA Plants by Capacity (Ktpa) and Current Status – France
  • IPA Plant details (location, region, year of commissioning) – France
  • Announced and Upcoming IPA Plants with Capacity – France

Germany

  • IPA Capacity (Ktpa) at plant-level by Feedstock Type and Production Process – Germany
  • IPA Capacity (Ktpa) at plant-level by Product Type and Unit Type – Germany
  • Count of IPA Plants with overall operational capacity – Germany
  • IPA Plants by Capacity (Ktpa) and Current Status – Germany
  • IPA Plant details (location, region, year of commissioning) – Germany
  • Announced and Upcoming IPA Plants with Capacity – Germany

Netherlands

  • IPA Capacity (Ktpa) at plant-level by Feedstock Type and Production Process – Netherlands
  • IPA Capacity (Ktpa) at plant-level by Product Type and Unit Type – Netherlands
  • Count of IPA Plants with overall operational capacity – Netherlands
  • IPA Plants by Capacity (Ktpa) and Current Status – Netherlands
  • IPA Plant details (location, region, year of commissioning) – Netherlands
  • Announced and Upcoming IPA Plants with Capacity – Netherlands

Argentina

  • IPA Capacity (Ktpa) at plant-level by Feedstock Type and Production Process – Argentina
  • IPA Capacity (Ktpa) at plant-level by Product Type and Unit Type – Argentina
  • Count of IPA Plants with overall operational capacity – Argentina
  • IPA Plants by Capacity (Ktpa) and Current Status – Argentina
  • IPA Plant details (location, region, year of commissioning) – Argentina
  • Announced and Upcoming IPA Plants with Capacity – Argentina

Daily Operations Tracker

Regional Tracking

Asia Pacific

  • Total Operational Capacity (Ktpa) at plant level
  • Total Disrupted Capacity (Ktpa) and Production Loss (Kt) at plant level
  • Plant Outage Duration (Start Date and End Date)
  • Disruption Cause and Impact on Price
  • Plant Disruption by disruption type (Permanent or Temporary)

Europe

  • Total Operational Capacity (Ktpa) at plant level
  • Total Disrupted Capacity (Ktpa) and Production Loss (Kt) at plant level
  • Plant Outage Duration (Start Date and End Date)
  • Disruption Cause and Impact on Price
  • Plant Disruption by disruption type (Permanent or Temporary)

North America

  • Total Operational Capacity (Ktpa) at plant level
  • Total Disrupted Capacity (Ktpa) and Production Loss (Kt) at plant level
  • Plant Outage Duration (Start Date and End Date)
  • Disruption Cause and Impact on Price
  • Plant Disruption by disruption type (Permanent or Temporary)

South America

  • Total Operational Capacity (Ktpa) at plant level
  • Total Disrupted Capacity (Ktpa) and Production Loss (Kt) at plant level
  • Plant Outage Duration (Start Date and End Date)
  • Disruption Cause and Impact on Price
  • Plant Disruption by disruption type (Permanent or Temporary)

Country-wise Tracking

China

  • Total Operational Capacity (Ktpa) at plant level
  • Total Disrupted Capacity (Ktpa) and Production Loss (Kt) at plant level
  • Plant Outage Duration (Start Date and End Date)
  • Disruption Cause and Impact on Price
  • Plant Disruption by disruption type (Permanent or Temporary)

India

  • Total Operational Capacity (Ktpa) at plant level
  • Total Disrupted Capacity (Ktpa) and Production Loss (Kt) at plant level
  • Plant Outage Duration (Start Date and End Date)
  • Disruption Cause and Impact on Price
  • Plant Disruption by disruption type (Permanent or Temporary)

Japan

  • Total Operational Capacity (Ktpa) at plant level
  • Total Disrupted Capacity (Ktpa) and Production Loss (Kt) at plant level
  • Plant Outage Duration (Start Date and End Date)
  • Disruption Cause and Impact on Price
  • Plant Disruption by disruption type (Permanent or Temporary)

Singapore

  • Total Operational Capacity (Ktpa) at plant level
  • Total Disrupted Capacity (Ktpa) and Production Loss (Kt) at plant level
  • Plant Outage Duration (Start Date and End Date)
  • Disruption Cause and Impact on Price
  • Plant Disruption by disruption type (Permanent or Temporary)

South Korea

  • Total Operational Capacity (Ktpa) at plant level
  • Total Disrupted Capacity (Ktpa) and Production Loss (Kt) at plant level
  • Plant Outage Duration (Start Date and End Date)
  • Disruption Cause and Impact on Price
  • Plant Disruption by disruption type (Permanent or Temporary)

Taiwan

  • Total Operational Capacity (Ktpa) at plant level
  • Total Disrupted Capacity (Ktpa) and Production Loss (Kt) at plant level
  • Plant Outage Duration (Start Date and End Date)
  • Disruption Cause and Impact on Price
  • Plant Disruption by disruption type (Permanent or Temporary)

France

  • Total Operational Capacity (Ktpa) at plant level
  • Total Disrupted Capacity (Ktpa) and Production Loss (Kt) at plant level
  • Plant Outage Duration (Start Date and End Date)
  • Disruption Cause and Impact on Price
  • Plant Disruption by disruption type (Permanent or Temporary)

Germany

  • Total Operational Capacity (Ktpa) at plant level
  • Total Disrupted Capacity (Ktpa) and Production Loss (Kt) at plant level
  • Plant Outage Duration (Start Date and End Date)
  • Disruption Cause and Impact on Price
  • Plant Disruption by disruption type (Permanent or Temporary)

Netherlands

  • Total Operational Capacity (Ktpa) at plant level
  • Total Disrupted Capacity (Ktpa) and Production Loss (Kt) at plant level
  • Plant Outage Duration (Start Date and End Date)
  • Disruption Cause and Impact on Price
  • Plant Disruption by disruption type (Permanent or Temporary)

Canada

  • Total Operational Capacity (Ktpa) at plant level
  • Total Disrupted Capacity (Ktpa) and Production Loss (Kt) at plant level
  • Plant Outage Duration (Start Date and End Date)
  • Disruption Cause and Impact on Price
  • Plant Disruption by disruption type (Permanent or Temporary)

USA

  • Total Operational Capacity (Ktpa) at plant level
  • Total Disrupted Capacity (Ktpa) and Production Loss (Kt) at plant level
  • Plant Outage Duration (Start Date and End Date)
  • Disruption Cause and Impact on Price
  • Plant Disruption by disruption type (Permanent or Temporary)

Argentina

  • Total Operational Capacity (Ktpa) at plant level
  • Total Disrupted Capacity (Ktpa) and Production Loss (Kt) at plant level
  • Plant Outage Duration (Start Date and End Date)
  • Disruption Cause and Impact on Price
  • Plant Disruption by disruption type (Permanent or Temporary)

Frequently Asked Questions – Isopropyl Alcohol (IPA) G.I.O Tracker

What is the IPA GIO Tracker?

The IPA GIO Tracker is an asset-level operational intelligence platform that monitors global IPA capacity, daily disruptions, production loss, and price impact across major producing regions.

What does the IPA GIO Tracker monitor?

It tracks IPA capacity (Mtpa), production process (propylene hydration/acetone hydrogenation), feedstock dependency, operational status, capacity additions, new plant commissioning, shutdowns, maintenance turnarounds, restarts, outage duration, and quantified production loss at the facility level.

How frequently is the data updated?

Plant-level operational status and disruption signals are updated daily to provide real-time visibility into global IPA supply developments.

How is production loss calculated?

Each IPA disruption is assessed based on affected capacity, outage duration, and operating status to estimate measurable production loss (Mtpa), enabling structured impact analysis.

Does the IPA GIO Tracker cover global or regional markets?

It provides global coverage with structured regional and country-level drill-down across Asia-Pacific, Europe, North America and South America.

Who benefits from IPA GIO Tracker?

Pharmaceutical manufacturers, electronics producers, raw material procurement teams, commodity traders, supply chain risk managers, and strategy teams use the platform to anticipate IPA supply shifts and pricing risks.

How does it differ from country-level IPA production reports?

Unlike aggregated national statistics, the IPA GIO Tracker monitors individual IPA facilities, enabling early identification of supply risks before they are reflected in official production data.

How does it help manage IPA supply risk?

By quantifying production loss, tracking outage duration, and mapping downstream exposure to pharmaceuticals, electronics, solvents, and cleaning markets, the platform supports proactive procurement, trading, and strategic planning decisions.

Can I analyse IPA alongside other commodities?

Yes. The IPA GIO Tracker applies a consistent plant-level intelligence framework that allows users to compare IPA disruptions, capacity shifts, and supply risks alongside other chemical value chains. Standardized metrics such as capacity (Mtpa), outage duration, and quantified production loss enable cross-commodity risk comparison and identification of ripple effects across the pharmaceutical and electronics ecosystem.

Get Full Access to Isopropyl Alcohol (IPA) Intelligence Subscribe to unlock facility-level data, daily disruption alerts and full G.I.O Tracker coverage.

UPGRADE NOW