Salt (NaCl) G.I.O Tracker: Plant-Level Capacity and Daily Disruption Tracking & Impact Assessment Since 2015

Overview

The global salt market is characterized by a highly integrated production base, significant capital investments, and supply chains sensitive to fluctuations.

The GIO Tracker provides daily, asset-level insights into Salt facilities, monitoring production capacity, feedstock dependencies (primarily brine and rock salt deposits), operational status, plant outages, and maintenance histories across major production regions. Salt is a critical feedstock in the production of chlorine, caustic soda, soda ash, and de-icing products, and is significantly impacted by shifts in the prices of crude oil and energy inputs.

GIO tracker helps industry players manage supply chain risks, optimize procurement strategies, and maintain production continuity amidst global market volatility. By providing detailed disruption insights, it supports proactive decision-making for businesses dependent on salt, ensuring resilience in operations and mitigating potential market shocks in key sectors.

35+ Countries
170+ Production Facilities
120+ Operating Companies
300+ MMTPA Annual Capacity Tracked

Salt (NaCl) Downstream Impact Mapping

Salt is an essential raw material in a wide range of industries, including chemicals, food processing, agriculture, deicing, and pharmaceuticals. Disruptions in salt production, caused by feedstock shortages (such as brine or rock salt), plant outages, utility disruptions, or regulatory changes, can lead to increased raw material costs, supply shortages, extended procurement cycles, and operational inefficiencies. In the chemical industry, salt is used as a feedstock for producing chlorine, caustic soda, and other vital chemicals.

The food industry relies on salt for preservation, seasoning, and flavour enhancement, while agriculture uses it for animal feed and crop production. In the deicing sector, salt is crucial for winter road maintenance. Growing environmental concerns are driving the shift toward eco-friendly alternatives to traditional deicing salt and pushing for more sustainable salt production methods, influencing long-term market trends and supply chain dynamics.

Strategic Visibility – Salt (NaCl) G.I.O Tracker

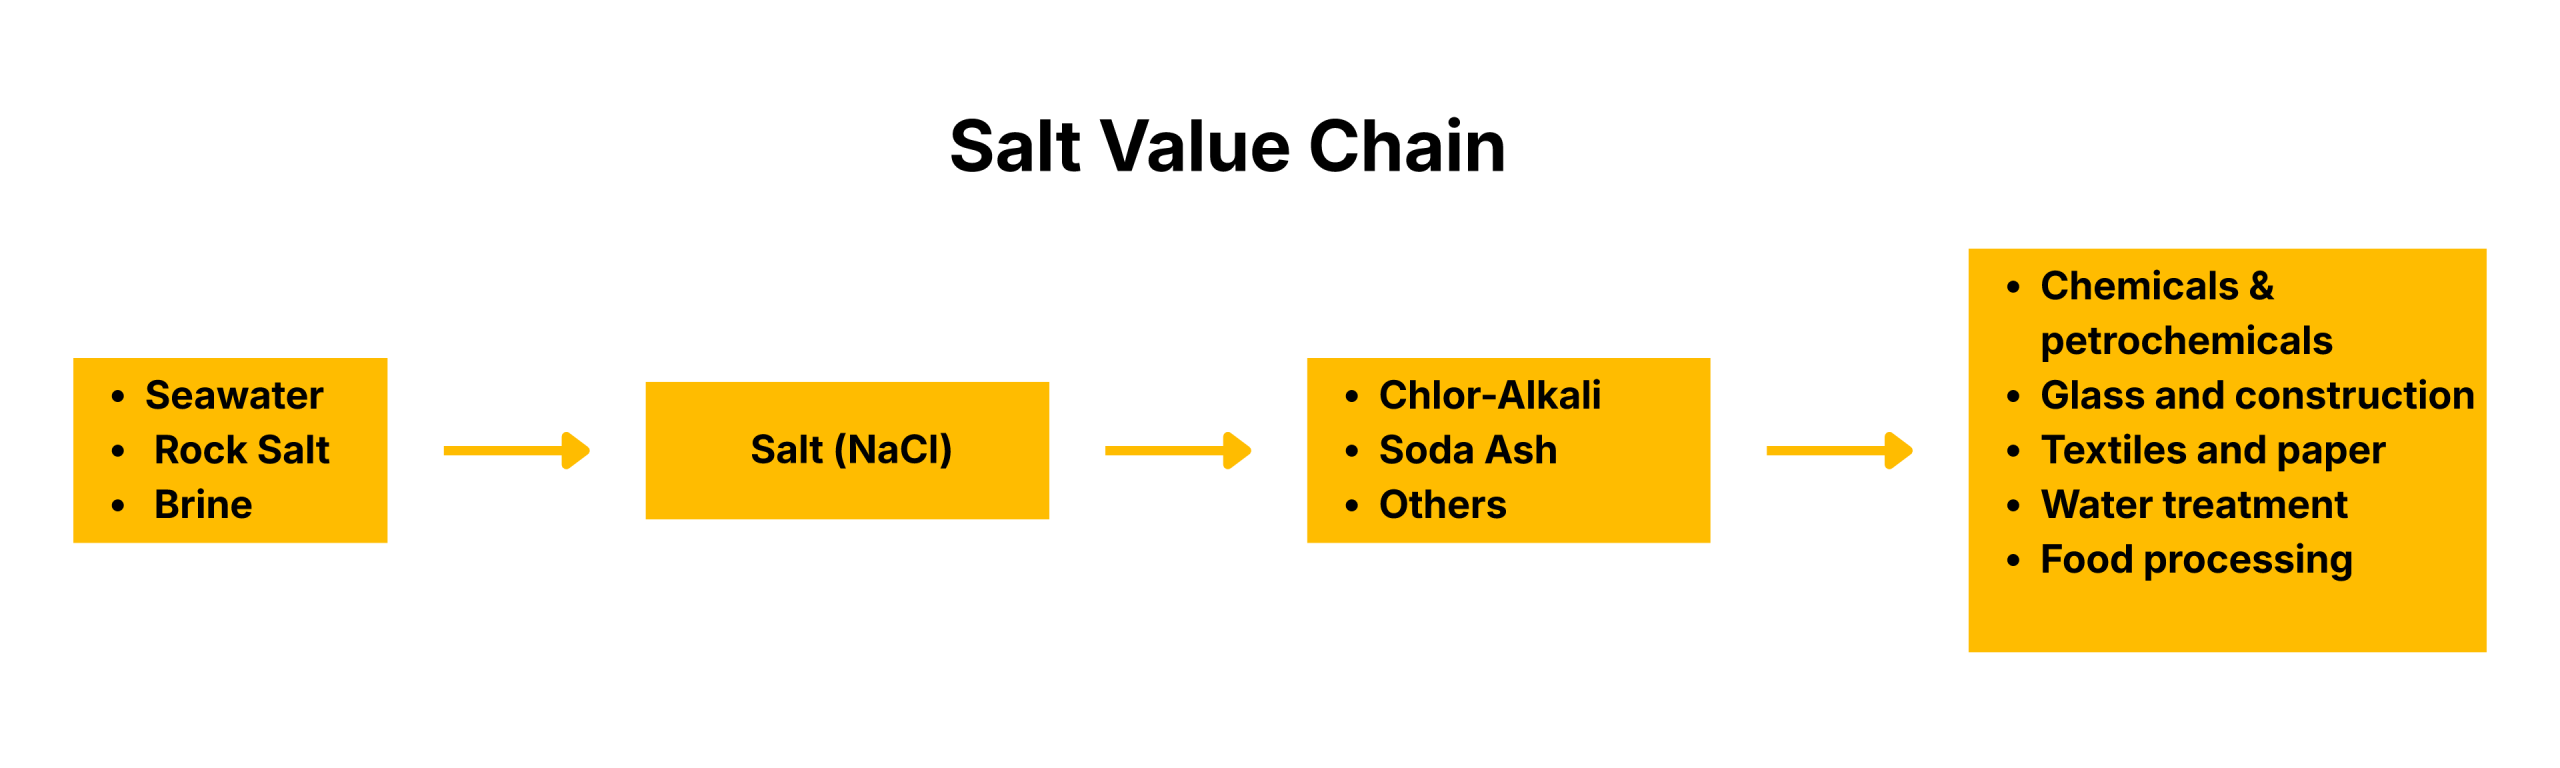
Salt production is a capital-intensive process, relying on key sources such as rock salt, brine, and seawater, making the market particularly sensitive to feedstock availability, weather conditions, and price volatility. Production is also vulnerable to operational disruptions, feedstock shortages, and fluctuations in costs. Any plant shutdowns, capacity reductions, or regulatory changes can create price instability and supply uncertainty for important downstream products like chlorine, caustic soda, and industrial-grade salt, which are used across chemicals, food preservation, deicing, and agricultural industries. The Global Salt Tracker offers plant-level insights and disruption alerts, allowing stakeholders to anticipate supply disruptions, manage procurement risks, optimize profit margins, and strengthen resilience throughout the global salt supply chain. This visibility enables businesses to effectively navigate market fluctuations and make informed strategic decisions.

Price Watch™ Salt (NaCl) G.I.O Tracker Coverage

Global Overview

Global salt production is over 290 million tonnes in 2025, marking a relatively stable growth compared to 2024. The Salt Industry GIO Tracker provides real-time, plant-level operational insights, with a particular focus on downstream market exposure.

Monitoring over 170 salt production facilities worldwide, including major producers in Asia-Pacific (China: 45M+ tpa; India:15M+ tpa) and North America (USA: 30M+ tpa), the tracker integrates data on nameplate capacity, operating rates, feedstock dependencies (including brine and rock salt), and disruption signals. It identifies vulnerabilities within the salt supply chain, impacting industries such as food processing, chemicals, de-icing, water treatment, and agriculture.

By tracking supply risks, outages, price fluctuations, and transportation bottlenecks, the tracker enables proactive decision-making, supports supply chain resilience, and fosters stability in global salt markets.

Asia Pacific Salt Plant Tracking

The Asia-Pacific Salt Industry Plant Tracker monitors over 60 salt production facilities, providing insights into operational risks, supply-demand balances, and capacity expansion. It aids businesses in forecasting market tightness, price fluctuations, and supply disruptions, supporting risk management and supply chain resilience for industries like chemical production, food processing, and de-icing.

  • China Salt Plant Tracking: Tracker monitors 25+ salt production facilities, accounting for over 50 million tonnes per annum (Mtpa), representing around 30% of global capacity. It provides updates on shutdowns, operating rate changes, feedstock issues, power restrictions, and new capacity start-ups, impacting global supply-demand, pricing, and risk management in industries like chemicals and food processing.
  • India Salt Plant Tracking: Tracker monitors more than 10+ salt production facilities, representing approximately 15 million tonnes per annum (Mtpa), representing 10% of global capacity. It provides updates on plant shutdowns, fluctuations in operating rates, feedstock constraints, power limitations, and new capacity additions, impacting global supply-demand balance, pricing trends, and risk management in industries like industrial salt, iodized salt, de-icing, food processing, and chemical manufacturing.

North America Salt Plant Tracking

The North America Salt Industry Plant Tracker monitors over 40 Salt production facilities, it assists businesses in forecasting market constraints, price volatility, and potential supply disruptions, thereby enhancing risk management and strengthening supply chain resilience in industries such as chemical production, food processing, and de-icing.

  • USA Salt Plant Tracking: Tracker monitors more than 25 salt production facilities, representing over 30 million tonnes per annum (Mtpa), which constitutes approximately 20% of global capacity. It provides updates on shutdowns, changes in operating rates, feedstock challenges, power limitations, and the commencement of new capacity, influencing global supply-demand dynamics, pricing, and risk management in industries such as chemicals and food processing.
  • Canada Salt Plant Tracking: The tracker monitors approximately 10 salt production facilities, accounting for over 10 million tonnes per annum (Mtpa), representing around 5% of global capacity. It delivers updates on shutdowns, operating rate fluctuations, feedstock issues, power constraints, and the initiation of new capacity, impacting global supply-demand balance, pricing, and risk management in industries such as chemicals and food processing.

Europe Salt Plant Tracking

The Europe Salt Industry Plant Tracker monitors approximately 50 salt production facilities helping businesses anticipate market constraints, price fluctuations, and potential supply disruptions. This supports improved risk management and bolsters supply chain resilience across industries such as chemical production, food processing, and de-icing.

  • Germany Salt Plant Tracking: Tracker monitors 10+ salt production facilities, accounting over 15+ million tonnes per annum (Mtpa), representing approximately 5% of global capacity. It provides updates on plant shutdowns, operating rate changes, feedstock and power constraints, and new capacity additions, influencing global supply-demand dynamics, pricing trends, and risk management in chemicals and food processing.
  • Poland Salt Plant Tracking: Tracker monitors 5+ salt production facilities, accounting over 5 million tonnes per annum (Mtpa), representing approximately 2% of global capacity. It delivers updates on plant shutdowns, variations in operating rates, feedstock constraints, power limitations, and new capacity commissioning, all of which shape global supply-demand balances, pricing trends, and risk mitigation strategies across the chemicals and food processing sectors.

Middle East & Africa Salt Plant Tracking

The MEA Salt Industry Plant Tracker monitors over 35 salt production facilities, enabling businesses to anticipate market constraints, price fluctuations, and potential supply disruptions. This enhances risk management and strengthens supply chain resilience across key industries, including chemical production, food processing, and de-icing.

  • Egypt Salt Plant Tracking: Tracker monitors 10+ salt production facilities, accounting over 5 million tonnes per annum (Mtpa), representing approximately 2% of global capacity. It offers insights into plant shutdowns, fluctuations in operating rates, feedstock limitations, power constraints, and the initiation of new capacity, all of which impact global supply-demand dynamics, pricing patterns, and risk management strategies in the chemicals and food processing industries.

Why Salt (NaCl) G.I.O Tracker

Salt (NaCl) G.I.O Tracker – Comprehensive Market Coverage & Intelligence Dashboard

Asset-Level Facility Intelligence

Regional Coverage

Asia Pacific

  • Salt Capacity (Ktpa) At Plant-Level By Feedstock Type And Production Process – Asia Pacific
  • Salt Capacity (Ktpa) At Plant-Level By Product Type And Unit Type – Asia Pacific
  • Count Of Salt Plants With Overall Operational Capacity – Asia Pacific
  • Salt Plants By Capacity (Ktpa) And Current Status – Asia Pacific
  • Salt Plant Details (Location, Region, Year Of Commissioning) – Asia Pacific
  • Announced And Upcoming Salt Plants With Capacity   – Asia Pacific

North America

  • Salt Capacity (Ktpa) At Plant-Level By Feedstock Type And Production Process – North America
  • Salt Capacity (Ktpa) At Plant-Level By Product Type And Unit Type – North America
  • Count Of Salt Plants With Overall Operational Capacity – North America
  • Salt Plants By Capacity (Ktpa) And Current Status – North America
  • Salt Plant Details (Location, Region, Year Of Commissioning) – North America
  • Announced And Upcoming Salt Plants With Capacity – North America

Europe

  • Salt Capacity (Ktpa) At Plant-Level By Feedstock Type And Production Process – Europe
  • Salt Capacity (Ktpa) At Plant-Level By Product Type And Unit Type – Europe
  • Count Of Salt Plants With Overall Operational Capacity – Europe
  • Salt Plants By Capacity (Ktpa) And Current Status – Europe
  • Salt Plant Details (Location, Region, Year Of Commissioning) – Europe
  • Announced And Upcoming Salt Plants With Capacity – Europe

Middle East & Africa

  • Salt Capacity (Ktpa) At Plant-Level By Feedstock Type And Production Process – Middle East & Africa
  • Salt Capacity (Ktpa) At Plant-Level By Product Type And Unit Type – Middle East & Africa
  • Count Of Salt Plants With Overall Operational Capacity – Middle East & Africa
  • Salt Plants By Capacity (Ktpa) And Current Status – Middle East & Africa
  • Salt Plant Details (Location, Region, Year Of Commissioning) – Middle East & Africa
  • Announced And Upcoming Salt Plants With Capacity – Middle East & Africa

Country-Level Coverage

China

  • Salt Capacity (Ktpa) At Plant-Level By Feedstock Type And Production Process – China
  • Salt Capacity (Ktpa) At Plant-Level By Product Type And Unit Type – China
  • Count Of Salt Plants With Overall Operational Capacity – China
  • Salt Plants By Capacity (Ktpa) And Current Status – China
  • Salt Plant Details (Location, Region, Year Of Commissioning) – China
  • Announced And Upcoming Salt Plants With Capacity – China

India

  • Salt Capacity (Ktpa) At Plant-Level By Feedstock Type And Production Process – India
  • Salt Capacity (Ktpa) At Plant-Level By Product Type And Unit Type – India
  • Count Of Salt Plants With Overall Operational Capacity – India
  • Salt Plants By Capacity (Ktpa) And Current Status – India
  • Salt Plant Details (Location, Region, Year Of Commissioning) – India
  • Announced And Upcoming Salt Plants With Capacity – India

Pakistan

  • Salt Capacity (Ktpa) At Plant-Level By Feedstock Type And Production Process – Pakistan
  • Salt Capacity (Ktpa) At Plant-Level By Product Type And Unit Type – Pakistan
  • Count Of Salt Plants With Overall Operational Capacity – Pakistan
  • Salt Plants By Capacity (Ktpa) And Current Status – Pakistan
  • Salt Plant Details (Location, Region, Year Of Commissioning) – Pakistan
  • Announced And Upcoming Salt Plants With Capacity – Pakistan

Taiwan

  • Salt Capacity (Ktpa) At Plant-Level By Feedstock Type And Production Process – Taiwan
  • Salt Capacity (Ktpa) At Plant-Level By Product Type And Unit Type – Taiwan
  • Count Of Salt Plants With Overall Operational Capacity – Taiwan
  • Salt Plants By Capacity (Ktpa) And Current Status – Taiwan
  • Salt Plant Details (Location, Region, Year Of Commissioning) – Taiwan
  • Announced And Upcoming Salt Plants With Capacity – Taiwan

Thailand

  • Salt Capacity (Ktpa) At Plant-Level By Feedstock Type And Production Process – Thailand
  • Salt Capacity (Ktpa) At Plant-Level By Product Type And Unit Type – Thailand
  • Count Of Salt Plants With Overall Operational Capacity – Thailand
  • Salt Plants By Capacity (Ktpa) And Current Status – Thailand
  • Salt Plant Details (Location, Region, Year Of Commissioning) – Thailand
  • Announced And Upcoming Salt Plants With Capacity – Thailand

Bangladesh

  • Salt Capacity (Ktpa) At Plant-Level By Feedstock Type And Production Process – Bangladesh
  • Salt Capacity (Ktpa) At Plant-Level By Product Type And Unit Type – Bangladesh
  • Count Of Salt Plants With Overall Operational Capacity – Bangladesh
  • Salt Plants By Capacity (Ktpa) And Current Status – Bangladesh
  • Salt Plant Details (Location, Region, Year Of Commissioning) – Bangladesh
  • Announced And Upcoming Salt Plants With Capacity – Bangladesh

Japan

  • Salt Capacity (Ktpa) At Plant-Level By Feedstock Type And Production Process – Japan
  • Salt Capacity (Ktpa) At Plant-Level By Product Type And Unit Type – Japan
  • Count Of Salt Plants With Overall Operational Capacity – Japan
  • Salt Plants By Capacity (Ktpa) And Current Status – Japan
  • Salt Plant Details (Location, Region, Year Of Commissioning) – Japan
  • Announced And Upcoming Salt Plants With Capacity – Japan

Vietnam

  • Salt Capacity (Ktpa) At Plant-Level By Feedstock Type And Production Process – Vietnam
  • Salt Capacity (Ktpa) At Plant-Level By Product Type And Unit Type – Vietnam
  • Count Of Salt Plants With Overall Operational Capacity – Vietnam
  • Salt Plants By Capacity (Ktpa) And Current Status – Vietnam
  • Salt Plant Details (Location, Region, Year Of Commissioning) –Vietnam
  • Announced And Upcoming Salt Plants With Capacity – Vietnam

Australia

  • Salt Capacity (Ktpa) At Plant-Level By Feedstock Type And Production Process – Australia
  • Salt Capacity (Ktpa) At Plant-Level By Product Type And Unit Type – Australia
  • Count Of Salt Plants With Overall Operational Capacity – Australia
  • Salt Plants By Capacity (Ktpa) And Current Status – Australia
  • Salt Plant Details (Location, Region, Year Of Commissioning) – Australia
  • Announced And Upcoming Salt Plants With Capacity – Australia

Indonesia

  • Salt Capacity (Ktpa) At Plant-Level By Feedstock Type And Production Process – Indonesia
  • Salt Capacity (Ktpa) At Plant-Level By Product Type And Unit Type – Indonesia
  • Count Of Salt Plants With Overall Operational Capacity – Indonesia
  • Salt Plants By Capacity (Ktpa) And Current Status – Indonesia
  • Salt Plant Details (Location, Region, Year Of Commissioning) – Indonesia
  • Announced And Upcoming Salt Plants With Capacity – Indonesia

Germany

  • Salt Capacity (Ktpa) At Plant-Level By Feedstock Type And Production Process – Germany
  • Salt Capacity (Ktpa) At Plant-Level By Product Type And Unit Type – Germany
  • Count Of Salt Plants With Overall Operational Capacity – Germany
  • Salt Plants By Capacity (Ktpa) And Current Status – Germany
  • Salt Plant Details (Location, Region, Year Of Commissioning) – Germany
  • Announced And Upcoming Salt Plants With Capacity – Germany

France

  • Salt Capacity (Ktpa) At Plant-Level By Feedstock Type And Production Process – France
  • Salt Capacity (Ktpa) At Plant-Level By Product Type And Unit Type – France
  • Count Of Salt Plants With Overall Operational Capacity – France
  • Salt Plants By Capacity (Ktpa) And Current Status – France
  • Salt Plant Details (Location, Region, Year Of Commissioning) – France
  • Announced And Upcoming Salt Plants With Capacity – France

Ireland

  • Salt Capacity (Ktpa) At Plant-Level By Feedstock Type And Production Process – Ireland
  • Salt Capacity (Ktpa) At Plant-Level By Product Type And Unit Type – Ireland
  • Count Of Salt Plants With Overall Operational Capacity – Ireland
  • Salt Plants By Capacity (Ktpa) And Current Status – Ireland
  • Salt Plant Details (Location, Region, Year Of Commissioning) – Ireland
  • Announced And Upcoming Salt Plants With Capacity – Ireland

Spain

  • Salt Capacity (Ktpa) At Plant-Level By Feedstock Type And Production Process – Spain
  • Salt Capacity (Ktpa) At Plant-Level By Product Type And Unit Type – Spain
  • Count Of Salt Plants With Overall Operational Capacity – Spain
  • Salt Plants By Capacity (Ktpa) And Current Status – Spain
  • Salt Plant Details (Location, Region, Year Of Commissioning) – Spain
  • Announced And Upcoming Salt Plants With Capacity – Spain

Belgium

  • Salt Capacity (Ktpa) At Plant-Level By Feedstock Type And Production Process – Belgium
  • Salt Capacity (Ktpa) At Plant-Level By Product Type And Unit Type – Belgium
  • Count Of Salt Plants With Overall Operational Capacity – Belgium
  • Salt Plants By Capacity (Ktpa) And Current Status – Belgium
  • Salt Plant Details (Location, Region, Year Of Commissioning) – Belgium
  • Announced And Upcoming Salt Plants With Capacity – Belgium

Poland

  • Salt Capacity (Ktpa) At Plant-Level By Feedstock Type And Production Process – Poland
  • Salt Capacity (Ktpa) At Plant-Level By Product Type And Unit Type – Poland
  • Count Of Salt Plants With Overall Operational Capacity – Poland
  • Salt Plants By Capacity (Ktpa) And Current Status – Poland
  • Salt Plant Details (Location, Region, Year Of Commissioning) – Poland
  • Announced And Upcoming Salt Plants With Capacity – Poland

Denmark

  • Salt Capacity (Ktpa) At Plant-Level By Feedstock Type And Production Process – Denmark
  • Salt Capacity (Ktpa) At Plant-Level By Product Type And Unit Type – Denmark
  • Count Of Salt Plants With Overall Operational Capacity – Denmark
  • Salt Plants By Capacity (Ktpa) And Current Status – Denmark
  • Salt Plant Details (Location, Region, Year Of Commissioning) – Denmark
  • Announced And Upcoming Salt Plants With Capacity – Denmark

Italy

  • Salt Capacity (Ktpa) At Plant-Level By Feedstock Type And Production Process – Italy
  • Salt Capacity (Ktpa) At Plant-Level By Product Type And Unit Type – Italy
  • Count Of Salt Plants With Overall Operational Capacity – Italy
  • Salt Plants By Capacity (Ktpa) And Current Status – Italy
  • Salt Plant Details (Location, Region, Year Of Commissioning) – Italy
  • Announced And Upcoming Salt Plants With Capacity – Italy

Switzerland

  • Salt Capacity (Ktpa) At Plant-Level By Feedstock Type And Production Process – Switzerland
  • Salt Capacity (Ktpa) At Plant-Level By Product Type And Unit Type – Switzerland
  • Count Of Salt Plants With Overall Operational Capacity – Switzerland
  • Salt Plants By Capacity (Ktpa) And Current Status – Switzerland
  • Salt Plant Details (Location, Region, Year Of Commissioning) – Switzerland
  • Announced And Upcoming Salt Plants With Capacity – Switzerland

UK

  • Salt Capacity (Ktpa) At Plant-Level By Feedstock Type And Production Process – UK
  • Salt Capacity (Ktpa) At Plant-Level By Product Type And Unit Type – UK
  • Count Of Salt Plants With Overall Operational Capacity – UK
  • Salt Plants By Capacity (Ktpa) And Current Status – UK
  • Salt Plant Details (Location, Region, Year Of Commissioning) – UK
  • Announced And Upcoming Salt Plants With Capacity – UK

Austria

  • Salt Capacity (Ktpa) At Plant-Level By Feedstock Type And Production Process – Austria
  • Salt Capacity (Ktpa) At Plant-Level By Product Type And Unit Type – Austria
  • Count Of Salt Plants With Overall Operational Capacity – Austria
  • Salt Plants By Capacity (Ktpa) And Current Status – Austria
  • Salt Plant Details (Location, Region, Year Of Commissioning) – Austria
  • Announced And Upcoming Salt Plants With Capacity – Austria

Netherlands

  • Salt Capacity (Ktpa) At Plant-Level By Feedstock Type And Production Process – Netherlands
  • Salt Capacity (Ktpa) At Plant-Level By Product Type And Unit Type – Netherlands
  • Count Of Salt Plants With Overall Operational Capacity – Netherlands
  • Salt Plants By Capacity (Ktpa) And Current Status – Netherlands
  • Salt Plant Details (Location, Region, Year Of Commissioning) – Netherlands
  • Announced And Upcoming Salt Plants With Capacity – Netherlands

Russia

  • Salt Capacity (Ktpa) At Plant-Level By Feedstock Type And Production Process – Russia
  • Salt Capacity (Ktpa) At Plant-Level By Product Type And Unit Type – Russia
  • Count Of Salt Plants With Overall Operational Capacity – Russia
  • Salt Plants By Capacity (Ktpa) And Current Status – Russia
  • Salt Plant Details (Location, Region, Year Of Commissioning) – Russia
  • Announced And Upcoming Salt Plants With Capacity – Russia

Turkey

  • Salt Capacity (Ktpa) At Plant-Level By Feedstock Type And Production Process – Turkey
  • Salt Capacity (Ktpa) At Plant-Level By Product Type And Unit Type – Turkey
  • Count Of Salt Plants With Overall Operational Capacity – Turkey
  • Salt Plants By Capacity (Ktpa) And Current Status – Turkey
  • Salt Plant Details (Location, Region, Year Of Commissioning) – Turkey
  • Announced And Upcoming Salt Plants With Capacity – Turkey

USA

  • Salt Capacity (Ktpa) At Plant-Level By Feedstock Type And Production Process – USA
  • Salt Capacity (Ktpa) At Plant-Level By Product Type And Unit Type – USA
  • Count Of Salt Plants With Overall Operational Capacity – USA
  • Salt Plants By Capacity (Ktpa) And Current Status – USA
  • Salt Plant Details (Location, Region, Year Of Commissioning) – USA
  • Announced And Upcoming Salt Plants With Capacity – USA

Mexico

  • Salt Capacity (Ktpa) At Plant-Level By Feedstock Type And Production Process – Mexico
  • Salt Capacity (Ktpa) At Plant-Level By Product Type And Unit Type – Mexico
  • Count Of Salt Plants With Overall Operational Capacity – Mexico
  • Salt Plants By Capacity (Ktpa) And Current Status – Mexico
  • Salt Plant Details (Location, Region, Year Of Commissioning) – Mexico
  • Announced And Upcoming Salt Plants With Capacity – Mexico

Canada

  • Salt Capacity (Ktpa) At Plant-Level By Feedstock Type And Production Process – Canada
  • Salt Capacity (Ktpa) At Plant-Level By Product Type And Unit Type – Canada
  • Count Of Salt Plants With Overall Operational Capacity – Canada
  • Salt Plants By Capacity (Ktpa) And Current Status – Canada
  • Salt Plant Details (Location, Region, Year Of Commissioning) – Canada
  • Announced And Upcoming Salt Plants With Capacity – Canada

Bahamas

  • Salt Capacity (Ktpa) At Plant-Level By Feedstock Type And Production Process – Bahamas
  • Salt Capacity (Ktpa) At Plant-Level By Product Type And Unit Type – Bahamas
  • Count Of Salt Plants With Overall Operational Capacity – Bahamas
  • Salt Plants By Capacity (Ktpa) And Current Status – Bahamas
  • Salt Plant Details (Location, Region, Year Of Commissioning) – Bahamas
  • Announced And Upcoming Salt Plants With Capacity – Bahamas

Iran

  • Salt Capacity (Ktpa) At Plant-Level By Feedstock Type And Production Process – Iran
  • Salt Capacity (Ktpa) At Plant-Level By Product Type And Unit Type – Iran
  • Count Of Salt Plants With Overall Operational Capacity – Iran
  • Salt Plants By Capacity (Ktpa) And Current Status – Iran
  • Salt Plant Details (Location, Region, Year Of Commissioning) – Iran
  • Announced And Upcoming Salt Plants With Capacity – Iran

Saudi Arabia

  • Salt Capacity (Ktpa) At Plant-Level By Feedstock Type And Production Process – Saudi Arabia
  • Salt Capacity (Ktpa) At Plant-Level By Product Type And Unit Type – Saudi Arabia
  • Count Of Salt Plants With Overall Operational Capacity – Saudi Arabia
  • Salt Plants By Capacity (Ktpa) And Current Status – Saudi Arabia
  • Salt Plant Details (Location, Region, Year Of Commissioning) – Saudi Arabia
  • Announced And Upcoming Salt Plants With Capacity – Saudi Arabia

Egypt

  • Salt Capacity (Ktpa) At Plant-Level By Feedstock Type And Production Process – Egypt
  • Salt Capacity (Ktpa) At Plant-Level By Product Type And Unit Type – Egypt
  • Count Of Salt Plants With Overall Operational Capacity – Egypt
  • Salt Plants By Capacity (Ktpa) And Current Status – Egypt
  • Salt Plant Details (Location, Region, Year Of Commissioning) – Egypt
  • Announced And Upcoming Salt Plants With Capacity – Egypt

Algeria

  • Salt Capacity (Ktpa) At Plant-Level By Feedstock Type And Production Process – Algeria
  • Salt Capacity (Ktpa) At Plant-Level By Product Type And Unit Type – Algeria
  • Count Of Salt Plants With Overall Operational Capacity – Algeria
  • Salt Plants By Capacity (Ktpa) And Current Status – Algeria
  • Salt Plant Details (Location, Region, Year Of Commissioning) – Algeria
  • Announced And Upcoming Salt Plants With Capacity – Algeria

South Africa

  • Salt Capacity (Ktpa) At Plant-Level By Feedstock Type And Production Process – South Africa
  • Salt Capacity (Ktpa) At Plant-Level By Product Type And Unit Type – South Africa
  • Count Of Salt Plants With Overall Operational Capacity – South Africa
  • Salt Plants By Capacity (Ktpa) And Current Status – South Africa
  • Salt Plant Details (Location, Region, Year Of Commissioning) – South Africa
  • Announced And Upcoming Salt Plants With Capacity – South Africa

Israel

  • Salt Capacity (Ktpa) At Plant-Level By Feedstock Type And Production Process – Israel
  • Salt Capacity (Ktpa) At Plant-Level By Product Type And Unit Type – Israel
  • Count Of Salt Plants With Overall Operational Capacity – Israel
  • Salt Plants By Capacity (Ktpa) And Current Status – Israel
  • Salt Plant Details (Location, Region, Year Of Commissioning) – Israel
  • Announced And Upcoming Salt Plants With Capacity – Israel

Cuba

  • Salt Capacity (Ktpa) At Plant-Level By Feedstock Type And Production Process – Cuba
  • Salt Capacity (Ktpa) At Plant-Level By Product Type And Unit Type – Cuba
  • Count Of Salt Plants With Overall Operational Capacity – Cuba
  • Salt Plants By Capacity (Ktpa) And Current Status – Cuba
  • Salt Plant Details (Location, Region, Year Of Commissioning) – Cuba
  • Announced And Upcoming Salt Plants With Capacity – Cuba

Botswana

  • Salt Capacity (Ktpa) At Plant-Level By Feedstock Type And Production Process – Botswana
  • Salt Capacity (Ktpa) At Plant-Level By Product Type And Unit Type – Botswana
  • Count Of Salt Plants With Overall Operational Capacity – Botswana
  • Salt Plants By Capacity (Ktpa) And Current Status – Botswana
  • Salt Plant Details (Location, Region, Year Of Commissioning) – Botswana
  • Announced And Upcoming Salt Plants With Capacity – Botswana

Tunisia

  • Salt Capacity (Ktpa) At Plant-Level By Feedstock Type And Production Process – Tunisia
  • Salt Capacity (Ktpa) At Plant-Level By Product Type And Unit Type – Tunisia
  • Count Of Salt Plants With Overall Operational Capacity – Tunisia
  • Salt Plants By Capacity (Ktpa) And Current Status – Tunisia
  • Salt Plant Details (Location, Region, Year Of Commissioning) – Tunisia
  • Announced And Upcoming Salt Plants With Capacity – Tunisia

Daily Operations Tracker

Regional Tracking

Asia Pacific

  • Total Operational Capacity (Ktpa) At Plant Level
  • Total Disrupted Capacity (Ktpa) And Production Loss (Kt) At Plant Level
  • Plant Outage Duration (Start Date And End Date)
  • Disruption Cause And Impact On Price
  • Plant Disruption By Disruption Type (Permanent Or Temporary)

Europe

  • Total Operational Capacity (Ktpa) At Plant Level
  • Total Disrupted Capacity (Ktpa) And Production Loss (Kt) At Plant Level
  • Plant Outage Duration (Start Date And End Date)
  • Disruption Cause And Impact On Price
  • Plant Disruption By Disruption Type (Permanent Or Temporary)

North America

  • Total Operational Capacity (Ktpa) At Plant Level
  • Total Disrupted Capacity (Ktpa) And Production Loss (Kt) At Plant Level
  • Plant Outage Duration (Start Date And End Date)
  • Disruption Cause And Impact On Price
  • Plant Disruption By Disruption Type (Permanent Or Temporary)

Middle East & Africa

  • Total Operational Capacity (Ktpa) At Plant Level
  • Total Disrupted Capacity (Ktpa) And Production Loss (Kt) At Plant Level
  • Plant Outage Duration (Start Date And End Date)
  • Disruption Cause And Impact On Price
  • Plant Disruption By Disruption Type (Permanent Or Temporary)

Country-Wise Tracking

China

  • Total Operational Capacity (Ktpa) At Plant Level
  • Total Disrupted Capacity (Ktpa) And Production Loss (Kt) At Plant Level
  • Plant Outage Duration (Start Date And End Date)
  • Disruption Cause And Impact On Price
  • Plant Disruption By Disruption Type (Permanent Or Temporary)

Taiwan

  • Total Operational Capacity (Ktpa) At Plant Level
  • Total Disrupted Capacity (Ktpa) And Production Loss (Kt) At Plant Level
  • Plant Outage Duration (Start Date And End Date)
  • Disruption Cause And Impact On Price
  • Plant Disruption By Disruption Type (Permanent Or Temporary)

Japan

  • Total Operational Capacity (Ktpa) At Plant Level
  • Total Disrupted Capacity (Ktpa) And Production Loss (Kt) At Plant Level
  • Plant Outage Duration (Start Date And End Date)
  • Disruption Cause And Impact On Price
  • Plant Disruption By Disruption Type (Permanent Or Temporary)

Australia

  • Total Operational Capacity (Ktpa) At Plant Level
  • Total Disrupted Capacity (Ktpa) And Production Loss (Kt) At Plant Level
  • Plant Outage Duration (Start Date And End Date)
  • Disruption Cause And Impact On Price
  • Plant Disruption By Disruption Type (Permanent Or Temporary)

India

  • Total Operational Capacity (Ktpa) At Plant Level
  • Total Disrupted Capacity (Ktpa) And Production Loss (Kt) At Plant Level
  • Plant Outage Duration (Start Date And End Date)
  • Disruption Cause And Impact On Price
  • Plant Disruption By Disruption Type (Permanent Or Temporary)

Bangladesh

  • Total Operational Capacity (Ktpa) At Plant Level
  • Total Disrupted Capacity (Ktpa) And Production Loss (Kt) At Plant Level
  • Plant Outage Duration (Start Date And End Date)
  • Disruption Cause And Impact On Price
  • Plant Disruption By Disruption Type (Permanent Or Temporary)

Pakistan

  • Total Operational Capacity (Ktpa) At Plant Level
  • Total Disrupted Capacity (Ktpa) And Production Loss (Kt) At Plant Level
  • Plant Outage Duration (Start Date And End Date)
  • Disruption Cause And Impact On Price
  • Plant Disruption By Disruption Type (Permanent Or Temporary)

Vietnam

  • Total Operational Capacity (Ktpa) At Plant Level
  • Total Disrupted Capacity (Ktpa) And Production Loss (Kt) At Plant Level
  • Plant Outage Duration (Start Date And End Date)
  • Disruption Cause And Impact On Price
  • Plant Disruption By Disruption Type (Permanent Or Temporary)

Indonesia

  • Total Operational Capacity (Ktpa) At Plant Level
  • Total Disrupted Capacity (Ktpa) And Production Loss (Kt) At Plant Level
  • Plant Outage Duration (Start Date And End Date)
  • Disruption Cause And Impact On Price
  • Plant Disruption By Disruption Type (Permanent Or Temporary)

Thailand

  • Total Operational Capacity (Ktpa) At Plant Level
  • Total Disrupted Capacity (Ktpa) And Production Loss (Kt) At Plant Level
  • Plant Outage Duration (Start Date And End Date)
  • Disruption Cause And Impact On Price
  • Plant Disruption By Disruption Type (Permanent Or Temporary)

Germany

  • Total Operational Capacity (Ktpa) At Plant Level
  • Total Disrupted Capacity (Ktpa) And Production Loss (Kt) At Plant Level
  • Plant Outage Duration (Start Date And End Date)
  • Disruption Cause And Impact On Price
  • Plant Disruption By Disruption Type (Permanent Or Temporary)

Netherlands

  • Total Operational Capacity (Ktpa) At Plant Level
  • Total Disrupted Capacity (Ktpa) And Production Loss (Kt) At Plant Level
  • Plant Outage Duration (Start Date And End Date)
  • Disruption Cause And Impact On Price
  • Plant Disruption By Disruption Type (Permanent Or Temporary)

Belgium

  • Total Operational Capacity (Ktpa) At Plant Level
  • Total Disrupted Capacity (Ktpa) And Production Loss (Kt) At Plant Level
  • Plant Outage Duration (Start Date And End Date)
  • Disruption Cause And Impact On Price
  • Plant Disruption By Disruption Type (Permanent Or Temporary)

France

  • Total Operational Capacity (Ktpa) At Plant Level
  • Total Disrupted Capacity (Ktpa) And Production Loss (Kt) At Plant Level
  • Plant Outage Duration (Start Date And End Date)
  • Disruption Cause And Impact On Price
  • Plant Disruption By Disruption Type (Permanent Or Temporary)

Spain

  • Total Operational Capacity (Ktpa) At Plant Level
  • Total Disrupted Capacity (Ktpa) And Production Loss (Kt) At Plant Level
  • Plant Outage Duration (Start Date And End Date)
  • Disruption Cause And Impact On Price
  • Plant Disruption By Disruption Type (Permanent Or Temporary)

Italy

  • Total Operational Capacity (Ktpa) At Plant Level
  • Total Disrupted Capacity (Ktpa) And Production Loss (Kt) At Plant Level
  • Plant Outage Duration (Start Date And End Date)
  • Disruption Cause And Impact On Price
  • Plant Disruption By Disruption Type (Permanent Or Temporary)

Switzerland

  • Total Operational Capacity (Ktpa) At Plant Level
  • Total Disrupted Capacity (Ktpa) And Production Loss (Kt) At Plant Level
  • Plant Outage Duration (Start Date And End Date)
  • Disruption Cause And Impact On Price
  • Plant Disruption By Disruption Type (Permanent Or Temporary)

UK

  • Total Operational Capacity (Ktpa) At Plant Level
  • Total Disrupted Capacity (Ktpa) And Production Loss (Kt) At Plant Level
  • Plant Outage Duration (Start Date And End Date)
  • Disruption Cause And Impact On Price
  • Plant Disruption By Disruption Type (Permanent Or Temporary)

Austria

  • Total Operational Capacity (Ktpa) At Plant Level
  • Total Disrupted Capacity (Ktpa) And Production Loss (Kt) At Plant Level
  • Plant Outage Duration (Start Date And End Date)
  • Disruption Cause And Impact On Price
  • Plant Disruption By Disruption Type (Permanent Or Temporary)

Denmark

  • Total Operational Capacity (Ktpa) At Plant Level
  • Total Disrupted Capacity (Ktpa) And Production Loss (Kt) At Plant Level
  • Plant Outage Duration (Start Date And End Date)
  • Disruption Cause And Impact On Price
  • Plant Disruption By Disruption Type (Permanent Or Temporary)

Poland

  • Total Operational Capacity (Ktpa) At Plant Level
  • Total Disrupted Capacity (Ktpa) And Production Loss (Kt) At Plant Level
  • Plant Outage Duration (Start Date And End Date)
  • Disruption Cause And Impact On Price
  • Plant Disruption By Disruption Type (Permanent Or Temporary)

Turkey

  • Total Operational Capacity (Ktpa) At Plant Level
  • Total Disrupted Capacity (Ktpa) And Production Loss (Kt) At Plant Level
  • Plant Outage Duration (Start Date And End Date)
  • Disruption Cause And Impact On Price
  • Plant Disruption By Disruption Type (Permanent Or Temporary)

Russia

  • Total Operational Capacity (Ktpa) At Plant Level
  • Total Disrupted Capacity (Ktpa) And Production Loss (Kt) At Plant Level
  • Plant Outage Duration (Start Date And End Date)
  • Disruption Cause And Impact On Price
  • Plant Disruption By Disruption Type (Permanent Or Temporary)

Ireland

  • Total Operational Capacity (Ktpa) At Plant Level
  • Total Disrupted Capacity (Ktpa) And Production Loss (Kt) At Plant Level
  • Plant Outage Duration (Start Date And End Date)
  • Disruption Cause And Impact On Price
  • Plant Disruption By Disruption Type (Permanent Or Temporary)

USA

  • Total Operational Capacity (Ktpa) At Plant Level
  • Total Disrupted Capacity (Ktpa) And Production Loss (Kt) At Plant Level
  • Plant Outage Duration (Start Date And End Date)
  • Disruption Cause And Impact On Price
  • Plant Disruption By Disruption Type (Permanent Or Temporary)

Mexico

  • Total Operational Capacity (Ktpa) At Plant Level
  • Total Disrupted Capacity (Ktpa) And Production Loss (Kt) At Plant Level
  • Plant Outage Duration (Start Date And End Date)
  • Disruption Cause And Impact On Price
  • Plant Disruption By Disruption Type (Permanent Or Temporary)

Canada

  • Total Operational Capacity (Ktpa) At Plant Level
  • Total Disrupted Capacity (Ktpa) And Production Loss (Kt) At Plant Level
  • Plant Outage Duration (Start Date And End Date)
  • Disruption Cause And Impact On Price
  • Plant Disruption By Disruption Type (Permanent Or Temporary)

Bahamas

  • Total Operational Capacity (Ktpa) At Plant Level
  • Total Disrupted Capacity (Ktpa) And Production Loss (Kt) At Plant Level
  • Plant Outage Duration (Start Date And End Date)
  • Disruption Cause And Impact On Price
  • Plant Disruption By Disruption Type (Permanent Or Temporary)

Saudi Arabia

  • Total Operational Capacity (Ktpa) At Plant Level
  • Total Disrupted Capacity (Ktpa) And Production Loss (Kt) At Plant Level
  • Plant Outage Duration (Start Date And End Date)
  • Disruption Cause And Impact On Price
  • Plant Disruption By Disruption Type (Permanent Or Temporary)

Iran

  • Total Operational Capacity (Ktpa) At Plant Level
  • Total Disrupted Capacity (Ktpa) And Production Loss (Kt) At Plant Level
  • Plant Outage Duration (Start Date And End Date)
  • Disruption Cause And Impact On Price
  • Plant Disruption By Disruption Type (Permanent Or Temporary)

Egypt

  • Total Operational Capacity (Ktpa) At Plant Level
  • Total Disrupted Capacity (Ktpa) And Production Loss (Kt) At Plant Level
  • Plant Outage Duration (Start Date And End Date)
  • Disruption Cause And Impact On Price
  • Plant Disruption By Disruption Type (Permanent Or Temporary)

South Africa

  • Total Operational Capacity (Ktpa) At Plant Level
  • Total Disrupted Capacity (Ktpa) And Production Loss (Kt) At Plant Level
  • Plant Outage Duration (Start Date And End Date)
  • Disruption Cause And Impact On Price
  • Plant Disruption By Disruption Type (Permanent Or Temporary)

Israel

  • Total Operational Capacity (Ktpa) At Plant Level
  • Total Disrupted Capacity (Ktpa) And Production Loss (Kt) At Plant Level
  • Plant Outage Duration (Start Date And End Date)
  • Disruption Cause And Impact On Price
  • Plant Disruption By Disruption Type (Permanent Or Temporary)

Algeria

  • Total Operational Capacity (Ktpa) At Plant Level
  • Total Disrupted Capacity (Ktpa) And Production Loss (Kt) At Plant Level
  • Plant Outage Duration (Start Date And End Date)
  • Disruption Cause And Impact On Price
  • Plant Disruption By Disruption Type (Permanent Or Temporary)

Botswana

  • Total Operational Capacity (Ktpa) At Plant Level
  • Total Disrupted Capacity (Ktpa) And Production Loss (Kt) At Plant Level
  • Plant Outage Duration (Start Date And End Date)
  • Disruption Cause And Impact On Price
  • Plant Disruption By Disruption Type (Permanent Or Temporary)

Cuba

  • Total Operational Capacity (Ktpa) At Plant Level
  • Total Disrupted Capacity (Ktpa) And Production Loss (Kt) At Plant Level
  • Plant Outage Duration (Start Date And End Date)
  • Disruption Cause And Impact On Price
  • Plant Disruption By Disruption Type (Permanent Or Temporary)

Tunisia

  • Total Operational Capacity (Ktpa) At Plant Level
  • Total Disrupted Capacity (Ktpa) And Production Loss (Kt) At Plant Level
  • Plant Outage Duration (Start Date And End Date)
  • Disruption Cause And Impact On Price
  • Plant Disruption By Disruption Type (Permanent Or Temporary)

Frequently Asked Questions – Salt (NaCl) G.I.O Tracker

What is the Salt GIO Tracker?

The Salt GIO Tracker is an asset-level intelligence platform that monitors global salt production capacity, operational disruptions, supply-demand imbalances, and price trends across major salt-producing regions.

What does the Salt GIO Tracker track?

It tracks salt production capacity (Mtpa), feedstock dependencies (e.g., brine, rock salt), plant operating rates, expansions, startups, shutdowns, maintenance turnarounds, restarts, outage durations, and quantified production losses at the facility level.

How often is the data updated?

Plant-level operational status, turnaround schedules, and disruption signals are updated daily to provide timely insights into global salt supply conditions.

How is production loss measured?

Production loss is calculated by assessing affected salt capacity, outage duration, operating rate reductions, feedstock constraints, and market demand shifts, offering an impact analysis across regional and global salt supply chains.

Does the Salt GIO Tracker cover global or regional markets?

The Salt Industry Tracker provides global coverage with detailed regional and country-level insights, including Asia-Pacific, Europe, North America, and Middle East and Africa

Who benefits from the Salt GIO Tracker?

The platform benefits salt producers, food processors, chemical manufacturers, procurement teams, commodity traders, supply chain risk managers, and professionals seeking early signals of supply shortages, price fluctuations, and disruptions.

How is it different from country-level salt production reports?

Unlike aggregated national statistics, the Salt Industry Tracker monitors individual salt production facilities, enabling early detection of shutdowns, feedstock disruptions, and capacity shifts, providing more granular and real-time insights.

How does it help manage Salt supply risk?

By quantifying production losses, tracking turnaround schedules, and assessing downstream impacts on chemical production, food processing, and de-icing, the platform enables proactive procurement, trading, and risk mitigation strategies.

Can I analyse Salt alongside other materials and commodities?

Yes, the Salt Industry Tracker applies a standardized plant-level framework, allowing comparison of salt disruptions, capacity movements, and supply risks with other commodities such as chemicals, petrochemicals, and minerals for cross-commodity risk assessment.

Get Full Access to Salt (NaCl) Intelligence Subscribe to unlock facility-level data, daily disruption alerts and full G.I.O Tracker coverage.

UPGRADE NOW