Red Phosphorus Price Trend and Forecast

âźł Weekly Update
|
Historical Data Since 2015
|
Forecast for 2026

red phosphorus Price Trends by Country

cnChina
inIndia
aeUnited Arab Emirates
usUnited States

Global red phosphorus Spot Market Prices, Trend Analysis and Forecast

Red Phosphorus Price Trend Q3 2025

In Q3 2025, the global Red Phosphorus market exhibited a slightly soft to stable trend, shaped by balanced supply and muted downstream demand from flame retardant, fertilizer additive, and chemical intermediate sectors. In East Asia, export prices remained largely steady as production and inventory levels were well-aligned with moderate export inquiries from key destinations.

South Asia experienced mild downward movement in domestic and export markets, with buyers adopting cautious procurement strategies amid sufficient stock availability. The Middle East also saw slight price easing as demand from pigment and flame-retardant industries remained subdued despite consistent supply from South Asia. Overall, the market-maintained equilibrium through the quarter, with stable operations and restrained trading activity keeping price movements limited.

China

Red Phosphorus Exported price in China, Phosphorus Content: 98%.

In Q3 2025, Red Phosphorus prices in China have remained almost flat, pressured by stable downstream demand in flame retardant and chemical intermediate applications. FOB Shanghai prices have ranged between USD 5500–5700 per metric ton, declining marginally by –0.22%.

In September 2025, Red Phosphorus prices in China have decreased by 1.03% compared to August 2025. Suppliers have cited balanced inventory levels and moderate export inquiries from Europe and Southeast Asia. Production rates have held steady, with mills adjusting output minimally to maintain market equilibrium, supporting a stable Red Phosphorus price trend in China.

India

Red Phosphorus Domestically Traded price in India, Phosphorus Content: 98%.

In Q3 2025, Red Phosphorus prices in India have eased slightly amid subdued demand from flame retardant and fertilizer additive sectors. Ex-Bhiwandi prices have fallen by 2.24% to USD 6200–6500 per metric ton, while export-oriented FOB Nhava Sheva values have dropped –2.18% to USD 6400–6800.

In September 2025, Red Phosphorus prices in India have decreased by 0.20% compared to the previous month. Producers have managed stable operating rates, and buyers have maintained cautious procurement amid adequate stocks. Market activity has been measured as both domestic and export buyers have awaited firmer demand signals, reflecting the Red Phosphorus price trend in India.

United Arab Emirates

Red Phosphorus Imported price in UAE from India, Phosphorus Content: 98%.

In Q3 2025, Red Phosphorus prices in the UAE have softened due to weaker buying from flame retardant and pigment manufacturers. CIF Jebel Ali prices have ranged between USD 6500–7400 per metric ton, marking a decline of 6.62%. In September 2025, Red Phosphorus prices in the UAE have declined by 0.69% compared to August 2025.

Importers have noted steady shipments from India, but cautious downstream consumption has limited purchase volumes. Freight and logistics have remained stable, contributing little support to pricing and shaping the Red Phosphorus price trend in UAE.

United States

Red Phosphorus Imported price in USA from India, Phosphorus Content: 98%.

According to PriceWatch, In Q3 2025, Red Phosphorus prices in the USA have declined under pressure from moderate demand in electronics and pigment sectors. CIF Houston prices have ranged from USD 6700–7600 per metric ton, reflecting a quarterly drop of 6.37%. In September 2025, Red Phosphorus prices in the USA have decreased by 1.14% compared to the previous month.

Import availability has stayed consistent, but buyers have maintained selective procurement amid sufficient inventories and subdued end-use consumption. Freight conditions have been stable, resulting in limited price recovery during the period, illustrating the Red Phosphorus price trend in the USA.

Red Phosphorus Price Trend Analysis: Q2 2025

Red Phosphorus witnessed a mixed pricing pattern through Q2 2025. Red Phosphorus prices initially rose in April, buoyed by strong international demand, particularly from the USA and UAE. This early-quarter uptick was supported by limited spot availability and firm export orders from pyrotechnic and flame-retardant industries. However, moving into May and June, prices in China showed a declining trend despite continued interest from export destinations.

The softening domestic industrial demand, combined with easing logistical pressures and increased producer output, contributed to the downward revision. In contrast, demand from the USA and UAE remained robust through the quarter, supported by seasonal applications and inventory buildup ahead of mid-year manufacturing cycles.

This created a divergence between China’s domestic pricing sentiment and that of key import markets. Despite easing prices toward quarter-end, Chinese exports continued to flow steadily. According to PriceWatch, Red Phosphorus prices were assessed at USD 5520/MT FOB Shanghai, by the end of Q2 2025.

Red Phosphorus prices in India remained on an upward trajectory through most of Q2 2025, driven primarily by strong demand from the agrochemical and pyrotechnics sectors. The quarter opened with heightened procurement from pesticide manufacturers in anticipation of pre-monsoon agricultural activity. Additionally, the match and fireworks industries in western India showed signs of revival during April and May, leading to sustained buying interest.

Despite the sharp surge in FOB Nhava Sheva prices, downstream markets like Ex-Bhiwandi began showing resistance by June due to inventory saturation and tightening working capital flows. While the global market remained relatively balanced, the Indian export front benefited from limited Chinese supply due to stricter environmental norms.

However, the moderation in domestic offtake toward June signalled a possible correction ahead. Nonetheless, Q2 closed with Red Phosphorus prices still elevated compared to Q1 levels. According to PriceWatch, Red Phosphorus prices were assessed at USD 6768/MT FOB Nhava Sheva, by the end of Q2 2025.

In Q1 2025, Red Phosphorus prices in China exhibited a mixed trajectory, shaped by variable demand across domestic and international markets. January saw a moderate price increase, driven by improved consumption from local manufacturers, particularly in the electronics and chemical sectors. However, February experienced a downturn as weak buying interest from key export destinations especially the UAE dampened momentum.

In March, prices recovered modestly, supported by active restocking from buyers in the USA ahead of anticipated seasonal demand. Despite these fluctuations, the market remained relatively balanced due to stable supply levels. The quarter closed at USD 5600/MT FOB China, reflecting cautious optimism among traders and end users.

Red Phosphorus prices in India maintained a consistent upward trend in Q1 2025. January and February experienced steady price increases, supported by strong domestic demand and active restocking. March 2025 saw further gains due to tight supply and robust buying interest from export markets as the procurements gained momentum. Red Phosphorus prices in the quarter end stood at USD 6574/MT Ex – Bhiwandi.

Red Phosphorus Price Trend Analysis: Q4 2024

Red Phosphorus prices in China followed a steady downward trajectory throughout Q4 2024, primarily influenced by an oversupplied market and subdued export activity. In October and November, the lack of strong international demand particularly from key buyers in the UAE and USA led to excess inventory, pushing prices lower. This bearish sentiment persisted into December, further pressured by aggressive pricing from competitors and limited spot market activity.

Despite stable domestic production, sluggish global procurement and unattractive margins discouraged bulk purchasing. With no significant supply disruptions or demand spikes, prices continued to slide. The quarter concluded with Red Phosphorus assessed at USD 5560/MT FOB China, marking a weak close to the year.

Q4 2024 witnessed fluctuating trends in Red Phosphorus prices in India. October faced a decline due to weak demand and ample supply. However, November 2024 saw a sharp rebound in Red Phosphorus prices, driven by renewed international demand, particularly from Southeast Asia. December continued this bullish momentum amid year-end stockpiling. The quarter closed with Red Phosphorus prices stood at USD 6683/MT FOB Nhava Sheva.

Red Phosphorus prices in China experienced slight volatility in Q3 2024. July recorded a price increase supported by higher demand from the electronics sector, but August and September saw decreasing prices amid weak demand from international markets, especially in the USA. Moreover, steady supply conditions in the UAE further pressured prices. After the conclusion of 3rd quarter, Red Phosphorus prices were assessed at at USD 5835/MT FOB China.

In Q3 2024, Red Phosphorus prices in India maintained a strong upward trajectory. July and August witnessed heightened demand, particularly from the electronics sector, driven by seasonal manufacturing cycles and increased production of flame retardant materials. This surge in consumption kept prices buoyant. In September, the bullish momentum continued as buyers engaged in strategic restocking ahead of anticipated year-end demand.

Although supply from the Nhava Sheva port remained stable, it was effectively absorbed by the high offtake, preventing downward pressure. Market sentiment remained optimistic, and consistent buying interest supported price gains. The quarter concluded at USD 6514/MT Ex-Bhiwandi, signaling continued strength.

The second quarter showed a continuation of the fluctuating trend for Red Phosphorus in China. Red Phosphorus prices rose in April as demand from the chemical sector increased amidst increased procurement activities, but the subsequent months saw a decline due to ample supply and limited buying interest from key markets like the UAE and USA. This downward pressure was attributed to subdued industrial activity in these regions. The 2nd quarter closed with Red Phosphorus prices stood at USD 5850/MT FOB China.

Red Phosphorus prices in India experienced notable volatility during Q2 2024. April saw an uptick in prices, supported by improved procurement from the chemical and industrial sectors. However, in May, the market corrected as sufficient inventory levels and lukewarm buying interest led to a decline. June brought a turnaround as supply tightened due to logistical issues and fewer overseas shipments, which reignited upward price momentum.

The interplay of inconsistent demand and fluctuating availability created uncertainty, prompting cautious buying strategies across end-user industries. The quarter ultimately closed with a modest gain, reaching USD 6522/MT FOB Nhava Sheva, reflecting balanced but reactive market behaviour.

Red Phosphorus prices in China exhibited mixed trends during Q1 2024. January witnessed an increase driven by rising domestic demand and supply concerns. However, February saw a decline, primarily due to stable supply conditions and lower purchasing interest. March further experienced a dip, reflecting weak downstream demand in the electronics and chemical industries. The 1st quarter concluded with Red Phosphorus prices at USD 6010/MT FOB China.

In Q1 2024, Red Phosphorus prices in India reflected a mixed trend influenced by fluctuating demand and stable supply conditions. January began on a positive note with strong domestic demand, especially from the chemical and pyrotechnics sectors, driving prices upward. However, February and March saw a reversal, with international demand weakening due to lower import interest and competitive global offers.

This external pressure, combined with steady supply from key ports like Nhava Sheva, resulted in oversupply concerns that weighed down prices. Overall, despite the initial surge, the quarter ended on a softer note with prices closing at USD 6354/MT Ex-Bhiwandi.

Technical Specifications of Red Phosphorus Price Trends

Product Description

Red Phosphorus is a stable, non-toxic allotrope of elemental phosphorus obtained by heating white phosphorus under controlled, oxygen-free conditions. It appears as a reddish-purple, amorphous powder distinguished by its excellent thermal stability and low reactivity under normal environments. It is non-volatile and resistant to spontaneous ignition and offers enhanced safety and handling properties. Its chemical stability and reduced environmental impact make it a preferred form of phosphorus for use in controlled and sustainable industrial processes.

Identifiers and Classification:

CAS No – 7723-14-0

HS code– 28047000

Molecular Formula – P

Molecular Weight[g/mol] – 30.97

Red Phosphorus – Synonyms:

• Amorphous Phosphorus
• Phosphorus, Red
• Stabilized Phosphorus
• Non-Volatile Phosphorus
• Allotropic Red Phosphorus
• RP (commonly used abbreviation in industry)

Red Phosphorus Grades Specific Price Assessment:

  • Phosphorus Content: 98%

Red Phosphorus Global Trade and Shipment Terms

  • Quotation Terms (Product & Country Specific): 10- 15 MT
  • Packaging Type (Product & Country Specific): 200 Kg Drum

Incoterms Referenced in Red Phosphorus Price Reporting

Shipping Term  Location  Definition 
FOB Shanghai  Shanghai, China  Red Phosphorus export price from China 
FOB Nhava Sheva  Nhava Sheva, India  Red Phosphorus export price from India 
Ex-Bhiwandi  Bhiwandi, India  Domestically traded Red Phosphorus price in Bhiwandi 
CIF Jebel Ali (India)  Jebel Ali, United Arab Emirates  Red Phosphorus import price in UAE from India 
CIF Houston (India)  Houston, USA  Red Phosphorus import price in USA from India 

Quotation Terms refers to the quantity range specified for the Red Phosphorus being quoted or offered in a commercial transaction.

Packaging Type refers to standard packaging size commonly used for Red Phosphorus packing, ease of handling, transportation, and storage in industrial and commercial applications.

Key Red Phosphorus Manufacturers

Manufacturer 
United Phosphorus Ltd (UPL) 
Prasol Chemicals Ltd. 
Mepco – The Metal Powder Company Ltd. 
Star Chemicals (Bombay) Pvt. Ltd. 
Hubei Xingfa Chemical Group Co., Ltd. 
Nippon Chemical Industrial Co., Ltd. 
ICL Group Ltd. 

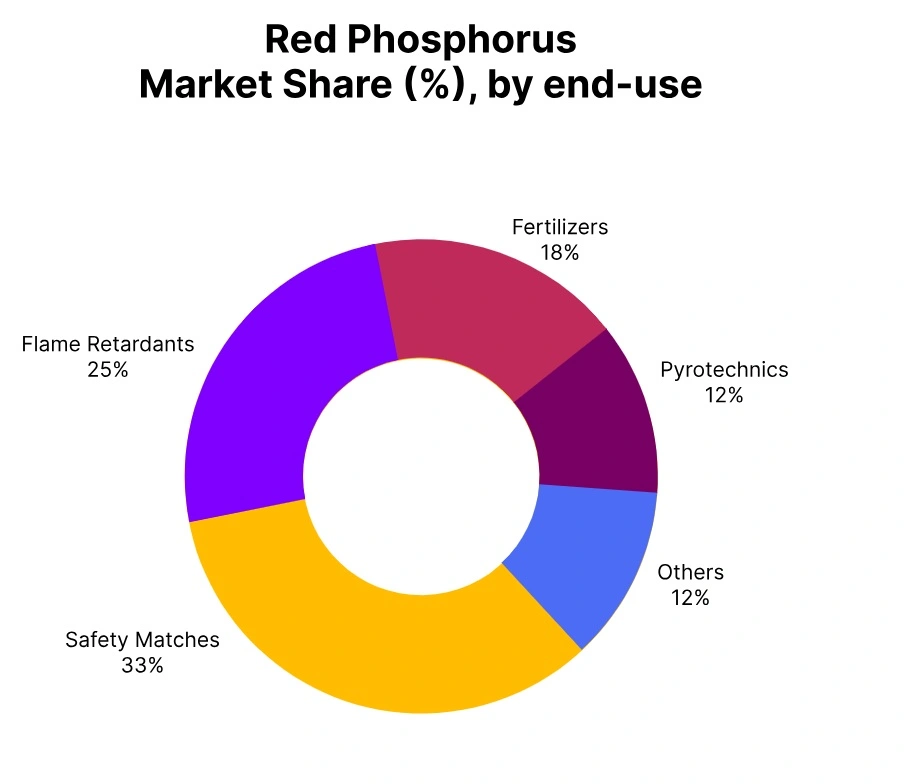
Red Phosphorus Industrial Applications

red phosphorus market share end use

Historically, several events have caused significant fluctuations in Red Phosphorus prices

Global Supply Chain Disruptions (2020-Present): The COVID-19 pandemic led to factory shutdowns and transportation delays, causing supply shortages and price volatility in the red phosphorus market.
Environmental Regulations (2015-2023): Stricter regulations on phosphorus production in various countries have impacted supply, leading to increased production costs and price hikes.
Geopolitical Tensions (2018-2020): Trade tensions between major economies affected the flow of raw materials and pricing dynamics, creating instability in the red phosphorus market.

These events highlight the red phosphorus market’s sensitivity to various global factors, emphasizing the need for ongoing monitoring of supply and demand trends.

Why PriceWatch?

PriceWatch is your trusted resource for tracking global red phosphorus price trends. Our platform delivers real-time data and expert analysis, offering deep insights into the key factors driving price fluctuations in the red phosphorus market. By monitoring critical events such as geopolitical tensions, supply chain disruptions, and economic shifts, PriceWatch keeps you fully informed of market dynamics.

In addition, PriceWatch provides detailed forecasts and updates on production capacities, enabling you to anticipate market changes and make well-informed decisions. With PriceWatch, you gain a competitive edge in understanding all the elements that influence red phosphorus prices worldwide. Stay ahead of the curve with PriceWatch’s reliable, accurate, and timely red phosphorus market data.

Track PriceWatch's red phosphorus price assessment on a weekly basis since 2015 onwards, along with short-term forecasts, and get access to the detailed report in a downloadable format.

Data Collection and Sources​

Real-Time Market Data: PriceWatch aggregates real-time pricing data from a variety of sources, including global commodity exchanges, industry reports, and proprietary databases. This ensures our assessments reflect the most current market conditions.
On-the-Ground Intelligence: Our team gathers insights directly from key market participants, including producers, suppliers, traders, and end-users across major red phosphorus production hubs. This ground-level intelligence is crucial for understanding localized market dynamics.
Supply Chain Monitoring: We track the entire red phosphorus supply chain, from raw material availability (e.g., phosphate rock, sulfur) to production and distribution channels. This includes monitoring feedstock prices, production capacities, and transportation logistics.

Event Tracking and Impact Analysis​

Geopolitical Tensions: PriceWatch continuously monitors global geopolitical developments, such as conflicts or trade disputes, that can significantly impact red phosphorus prices. Our analysis includes potential disruptions to supply chains and their immediate and long-term effects on pricing.
Environmental Regulations: We assess the impact of environmental regulations on red phosphorus production, as changes in laws can affect supply levels and production costs. Compliance challenges and adjustments are factored into our price forecasts.
Natural Disasters and Climate Events: We analyze the effects of natural disasters, such as floods or earthquakes, on red phosphorus production facilities, particularly in regions prone to such events. These disruptions are considered in our supply outlooks and pricing models.
Market Demand Fluctuations: We evaluate changes in demand from key sectors, such as flame retardants and electronics, to understand their impact on pricing and supply dynamics.

Production Capacity and Supply Analysis

Current Production Monitoring: We maintain a comprehensive database of global Red phosphorus production facilities, tracking their operational status, maintenance schedules, and output levels. This allows us to assess current supply availability accurately.
Future Capacity Projections: Our research includes detailed forecasts of upcoming red phosphorus production capacities, factoring in new plant constructions, expansions, and technological advancements. This helps in predicting future supply trends and potential price stabilization.

Demand Forecasting

Sectoral Demand Analysis: PriceWatch provides in-depth analysis of demand trends across key sectors, including agriculture and electronics. We track year-on-year demand growth and project future consumption patterns based on economic indicators and industry developments.
Global Demand Dynamics: Our methodology considers regional demand variations and how they influence global red phosphorus pricing. This includes understanding the impact of shifts in manufacturing bases, trade policies, and environmental regulations.

Pricing Model Development

Dynamic Pricing Models: PriceWatch utilizes advanced econometric models to forecast red phosphorus prices, incorporating real-time data, historical trends, and projected market conditions. Our models are continuously refined to enhance accuracy and predictive power.
Scenario Analysis: We conduct scenario-based assessments to evaluate potential future market conditions. This includes best-case, worst-case, and most likely scenarios, helping our clients prepare for a range of market outcomes.

Reporting and Client Support

Comprehensive Reports: Our clients receive detailed reports that include current price assessments, future price forecasts, and in-depth analysis of market drivers. These reports are designed to be actionable, providing clear insights and recommendations.
Ongoing Support: PriceWatch offers continuous updates and personalized support to our clients, ensuring they have the most up-to-date information to make informed decisions. Our experts are available to discuss specific market developments and provide tailored advice.

This research methodology ensures that PriceWatch delivers the most accurate, timely, and actionable red phosphorus pricing assessments, helping our clients stay ahead of market trends and make informed business decisions.

Red Phosphorus Market Price Trend provided by PriceWatch is a base price and excludes VAT/Taxes, discounts, or offers. The information herein is accurate to the best of our knowledge as of the date indicated and is provided solely for the convenience of our customers as a reference for red phosphorus. PriceWatch disclaims any warranties or representations regarding the accuracy of results derived from this information. It is the sole responsibility of the user to assess the suitability of the product for their specific application. This document does not constitute an endorsement to use the product in violation of any applicable patent rights.

The pricing of Red Phosphorus is influenced by several factors, including global supply and demand dynamics, the availability and cost of raw materials (primarily white phosphorus), and production costs. Regulatory restrictions on the use and transportation of Red Phosphorus due to its hazardous nature can also impact prices.

Additionally, fluctuations in energy prices, geopolitical events, and the economic conditions of major producing countries, such as China and the United States, play a critical role in shaping Red Phosphorus prices. Understanding these factors is essential for procurement heads to make informed purchasing decisions.

Procurement heads can forecast Red Phosphorus price trends by analyzing historical price data, monitoring global supply and demand shifts, and keeping track of changes in regulatory policies and raw material availability. Regularly consulting industry reports, engaging with market analysis services, and staying informed about geopolitical events affecting major producers can also aid in accurate price forecasting. This proactive approach helps in better planning, budgeting, and decision-making in procurement strategies.

Sustainability certifications and environmental regulations can significantly impact Red Phosphorus pricing. As stricter environmental policies are enforced, manufacturers may face higher production costs to comply with sustainability standards, leading to price increases. Moreover, a growing demand for eco-friendly and responsibly produced chemicals may result in premium pricing for Red Phosphorus that meets sustainability criteria.

For procurement heads, understanding these implications is crucial as it aligns with corporate sustainability goals and consumer preferences. While the initial costs may be higher, sourcing sustainably produced Red Phosphorus can enhance a company’s reputation and open up new business opportunities.