Price-Watch™ provides price assessments for Sodium Metabisulfite (SMBS) across top trading regions:
| Sodium Metabisulfite (SMBS) Regional Coverage | Sodium Metabisulfite (SMBS) Grade and Country Coverage | Sodium Metabisulfite (SMBS) Pricing Data Coverage Explanation |
|---|---|---|
| Asia-Pacific Sodium Metabisulfite (SMBS) Pricing Analysis | Sodium Metabisulfite (SMBS) Industrial Grade 96% min FOB Prices at Shanghai Port, China | Weekly Price Update on Sodium Metabisulfite (SMBS) Real-Time Export Prices from Shanghai Port, China to Global Markets |
| Sodium Metabisulfite (SMBS) Industrial Grade 96% min CIF Prices at Jakarta Port, Indonesia. Importing from China | Weekly Price Update on Sodium Metabisulfite (SMBS) Real-Time Import Prices at Jakarta Port, Indonesia, from China | |
| Sodium Metabisulfite (SMBS) Industrial Grade 96% min CIF Prices at Nhava Sheva Port, India. Importing from China | Weekly Price Update on Sodium Metabisulfite (SMBS) Real-Time Import Prices at Nhava Sheva Port, India, from China | |
| Sodium Metabisulfite (SMBS) Industrial Grade 96% min CIF Prices at Sydney Port, Australia. Importing from China | Weekly Price Update on Sodium Metabisulfite (SMBS) Real-Time Import Prices at Sydney Port, Australia, from China | |
| South America Sodium Metabisulfite (SMBS) Pricing Analysis | Sodium Metabisulfite (SMBS) Industrial Grade 96% min CIF Prices at Santos Port, Brazil. Importing from China | Weekly Price Update on Sodium Metabisulfite (SMBS) Real-Time Import Prices at Santos Port, Brazil, from China |
| Europe Sodium Metabisulfite (SMBS) Pricing Analysis | Sodium Metabisulfite (SMBS) Industrial Grade 96% min FD Prices at Hamburg, Germany | Weekly Price Update on Sodium Metabisulfite (SMBS) Real-Time Domestic Prices Delivered at Hamburg, Germany |
| Sodium Metabisulfite (SMBS) Industrial Grade 96% min FD Prices at Rotterdam, Netherlands | Weekly Price Update on Sodium Metabisulfite (SMBS) Real-Time Domestic Prices Delivered at Rotterdam, Netherlands | |
| Sodium Metabisulfite (SMBS) Industrial Grade 96% min FD Prices at Le Havre, France | Weekly Price Update on Sodium Metabisulfite (SMBS) Real-Time Domestic Prices Delivered at Le Havre, France |
Note: In assessments structured as CIF [Importing Port] (Exporting Country), the country mentioned in brackets indicates the primary origin of supply (exporting country), while the named port refers to the destination port in the importing country. Other Incoterms (FOB, FD, EXW, etc.) should be interpreted in accordance with standard international trade definitions.
Sodium Metabisulfite (SMBS) Price Trend Q1 2026
The Sodium Metabisulfite (SMBS) price trend in China, Brazil, Australia, Indonesia, India, Germany, Netherlands, and France in Q1 2026 has been marked by notable upward movement. Price values have been change from +2% to +30% increase.
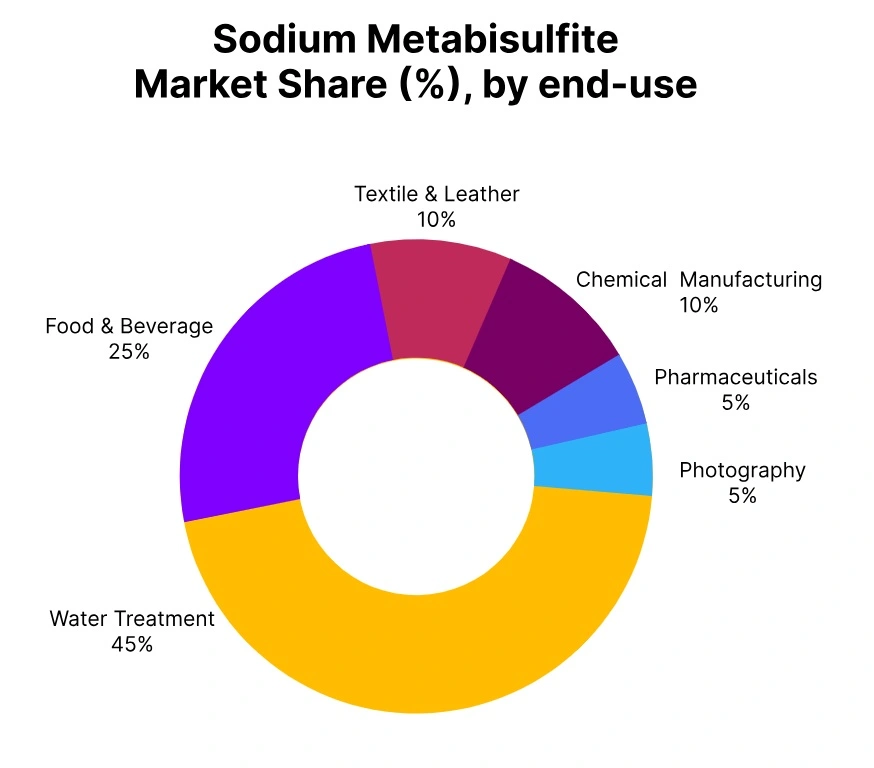
This Sodium Metabisulfite (SMBS) price trend is associated with ongoing demand from important end-use segments including water treatment, textiles, and food processing, together with a relatively steady supply of this commodity from the main markets.
As for China, Brazil, Australia, Indonesia, India, Germany, Netherlands, and France, the trend of Sodium Metabisulfite prices in these regions in March 2026 has remained relatively strong regarding periodic restocking operations and rising consumption patterns among different industries.
Also, this trend has been driven by steady manufacturing volumes with stable exporting supplies from such countries as China and Germany. Feedstock shortages have not affected this trend significantly due to resilient manufacturing and effective supply chain management, which resulted in price increase during the quarter.
China: Sodium Metabisulfite (SMBS) Export price from FOB Shanghai, China, Industrial Grade 96% min Purity
For Q1 2026, Sodium Metabisulfite prices in China has witnessed sharp bullishness during the quarter. In relation to the Sodium Metabisulfite price trend in China, prices have remained in an upward trajectory.
Specifically, prices on CIF basis have moved by -10% to +16%, while those on FOB basis have moved by -6% to +7%. This trend has been due to steady demand and supply shortages in the water treatment and industrial sectors.
In China, Sodium Metabisulfite prices in in March 2026 have seen an increase of 7% and 16% in relation to the prior month, as FOB and CIF prices respectively. The rise in the Sodium Metabisulfite price trend in China has been driven by high demand, supply shortages, and logistical problems.
These have led to higher prices, especially during times when shipment and port issues affect the product’s regional availability. However, stabilizing supply and production capacity could lead to reduced pressure on prices going forward.
Indonesia: Sodium Metabisulfite (SMBS) Imported price from CIF Jakarta (China), Indonesia, Industrial Grade 96% min Purity
According to Price-Watch™, in Quarter 1, 2026, the Sodium Metabisulfite price in Indonesia has witnessed sharp volatility. The Sodium Metabisulfite price trend in Indonesia has been generally mixed to soft as the CIF prices have varied between -6% and +7%.
In Indonesia, Sodium Metabisulfite price in March 2026 have fallen by 6% in February 2026, after which there has been a sudden rise of 7% in March 2026, indicating that there has been some volatility in monthly price changes.
The Sodium Metabisulfite price trend in Indonesia has been affected due to the combination of moderate demand and the supply chain adjustments which include the delay in international supplies, which is associated with importation from China. Even though there could be stability in the supply chain going forward and increased production, this may not reduce the prices of Sodium Metabisulfite soon.
Brazil: Sodium Metabisulfite (SMBS) Imported price from CIF Jakarta (China), Indonesia, Industrial Grade 96% min Purity
During the first quarter of 2026, the Sodium Metabisulfite price in Brazil, supplied from China has witnessed a bearish trend. The Sodium Metabisulfite price trend in Brazil has been mixed since there is an initial decrease in CIF prices by -6% to -3%, which is followed by a significant gain of 16% in March.
In Brazil, Sodium Metabisulfite price in March 2026 has seen a sharp increase due to steady demand from industries and limited supply, coupled with logistics cost increases. The trend of Sodium Metabisulfite price in Brazil has been impacted negatively due to logistical issues such as delayed imports and congested ports, causing the CIF price to spike.
Despite relative stability within the international market, local disruptions have caused the prices to become increasingly volatile. As conditions normalize and supply capabilities increase, it can be anticipated that prices will fall in the upcoming quarter.
Australia: Sodium Metabisulfite (SMBS) Imported price from CIF Jakarta (China), Indonesia, Industrial Grade 96% min Purity
In Q1 2026, Sodium Metabisulfite prices in Australia which are imported from China has witnessed sharp volatility. The Sodium Metabisulfite price trend in Australia for the quarter shows a mixed trend of CIF prices fluctuating between -10% and +5%.
In Australia, Sodium Metabisulfite prices in February 2026 have fallen by 10%, and there is an upturn in March, where the price rose by 5%. This is a result of the changing monthly dynamics in prices for this commodity.
Factors that have contributed to the change in the Sodium Metabisulfite price trend include cargo availability changes, purchasing dynamics, constant manufacturing rates, and growth in demand for consumption. The rise in March prices is attributed to logistical disruptions, possibly fueled by geopolitical issues, limiting availability in the region.
India: Sodium Metabisulfite (SMBS) imported price from CIF Nhava Sheva (China), India, Industrial Grade 96% min Purity
India: SMBS Domestically Traded price in Mumbai, India, Industrial Grade 96% min Purity
In Q1 2026, the Sodium Metabisulfite price in India particularly at Ex-Gujarat has witnessed strong volatility during the quarter. The Sodium Metabisulfite price trend in India showed a significant upward movement, with CIF prices increasing by -10% to +30%, and Ex-Gujarat prices rising by +2% to +7%. A sharp price increase of 30% occurred in March for CIF prices, while Ex-Gujarat prices saw a rise of 7%.
The price surge is driven by steady demand from key sectors, such as water treatment and industrial applications, alongside ongoing supply constraints and rising logistics costs. The Indian market, particularly Ex-Gujarat, faced challenges due to delays in international shipments, port congestion, and a weaker rupee, which further increased import costs.
In India, Sodium Metabisulfite price in March 2026 remained relatively stable, regional supply chain disruptions and logistical bottlenecks contributed to the upward price movement. As supply chains gradually stabilize and production capacity increases, the Sodium Metabisulfite price in India may ease in the coming quarter. However, strong demand and potential disruptions could continue to support higher pricing.
Germany: Sodium Metabisulfite (SMBS) Free delivered price within the Germany, Industrial Grade 96% min Purity
In Q1 2026, the Sodium Metabisulfite price in Germany at FD Hamburg has witnessed bullish trend. The Sodium Metabisulfite price trend in Germany showed a steady increase, with prices rising by +0% to +5%. A notable price increase of 5% occurred in March, reflecting steady demand and regional supply conditions.
The market remained stable throughout the quarter, with consumption growing at a steady pace. In Germany, Sodium Metabisulfite price in March 2026 showed relatively stable conditions, regional supply chain disruptions and logistical factors contributed to the price movement.
As supply chains stabilize and production capacity increases, the price of Sodium Metabisulfite in Germany may remain stable or ease slightly in the coming quarter, but demand could continue to support higher pricing.
Netherlands: Sodium Metabisulfite (SMBS) Free delivered price within the Netherlands, Industrial Grade 96% min Purity
In Q1 2026, the Sodium Metabisulfite price in the Netherlands at FD Rotterdam has witnessed stability. The Sodium Metabisulfite price trend in the Netherlands showed steady growth, with prices rising by +0% to +5%.
A price increase of 5% occurred in March, reflecting stable demand and regional supply. In the Netherlands, Sodium Metabisulfite price in the March 2026 remained steady throughout the quarter, with consumption continuing at a consistent pace in key sectors.
The global Sodium Metabisulfite market remained stable, but regional supply chain disruptions and logistical factors played a role in the price increase. As production capacity increases and supply chains stabilize, the price of Sodium Metabisulfite in the Netherlands may ease in the next quarter, although demand could continue to support higher pricing.
France: Sodium Metabisulfite (SMBS) Free delivered price within the France, Industrial Grade 96% min Purity
In Q1 2026, the Sodium Metabisulfite price in France at FD Le Havre has witnessed stability. The Sodium Metabisulfite price trend in France showed steady growth, with prices rising by +0% to +5%. A 5% increase occurred in March, driven by steady demand and supply chain adjustments.
The market showed consistent growth throughout the quarter, with consumption continuing at a steady pace. In France, Sodium Metabisulfite price in March 2026 remained stable, regional supply chain disruptions contributed to the upward price movement.
As supply chains stabilize and production capacity increases, the price of Sodium Metabisulfite in France may stabilize in the coming quarter, but sustained demand could continue to support higher pricing.