Price Watch™ provides real-time price assessments and price forecasts for C10 Solvent across top trading regions:
| C10 Solvent Regional Coverage | C10 Solvent Grade and Country Coverage | C10 Solvent Pricing Data Coverage Explanation |
| Asia-Pacific C10 Solvent Pricing Analysis | C10 Solvent (Aromatic Wt% ≥ 99%) FOB Prices at Busan Port, South Korea | Weekly Price Update of C10 Solvent Real-Time Export Prices from Busan Port, South Korea to Global Markets |
| C10 Solvent (Aromatic Wt% ≥ 99%) CIF Prices at Nhava Sheva Port, India, Importing from South Korea | Weekly Price Update of C10 Solvent Real-Time Import Prices at Nhava Sheva Port, India, Importing from South Korea | |
| C10 Solvent (Aromatic Wt% ≥ 99%) CIF Prices at Jakarta Port, Indonesia, Importing from South Korea | Weekly Price Update of C10 Solvent Real-Time Import Prices at Jakarta Port, Indonesia Importing from South Korea | |
| C10 Solvent (Aromatic Wt% ≥ 99%) Ex-Mumbai Domestic Prices, India | Weekly Price Update of C10 Solvent Real-Time Domestic Prices in Mumbai, India |
C10 Solvent Price Forecasts & Market Foresight Q3 2026
Outlook: Bearish to Strongly Bearish
Confidence: High
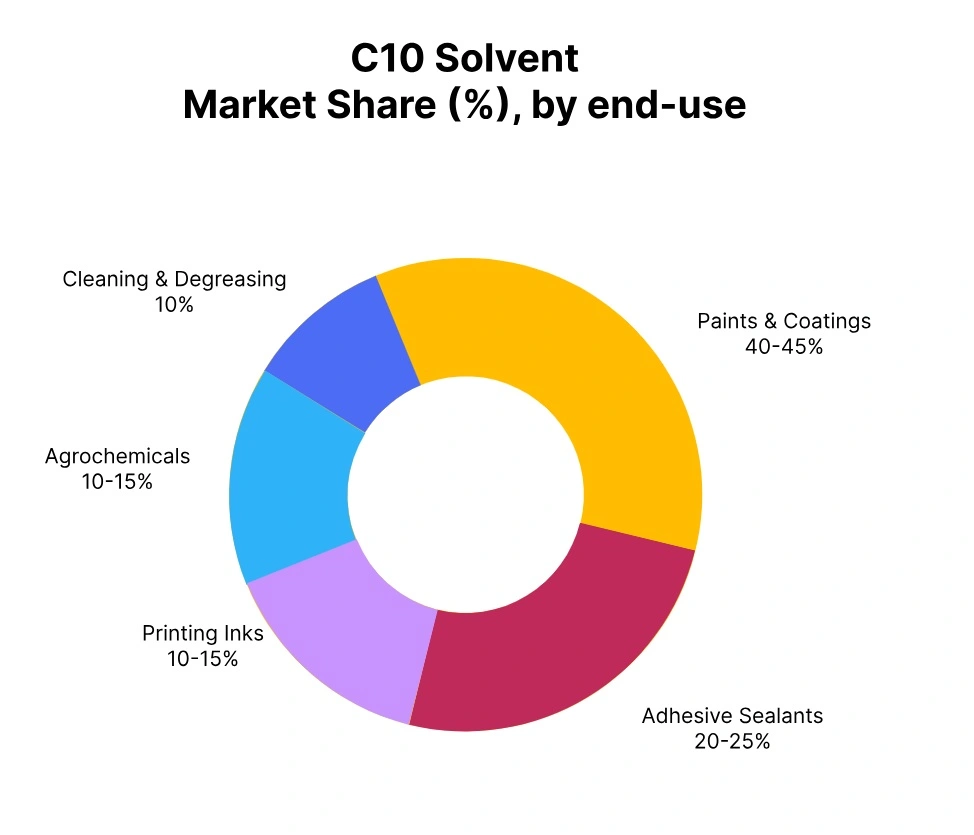
C10 Solvent prices across Asia are expected to remain on a bearish trajectory during Q3 2026, driven by soft feedstock costs, comfortable supply levels, and weak downstream demand from paints, printing inks, and agrochemical formulation industries amid the monsoon season.
South Korea is likely to witness consistent downward pressure, supported by ample export availability and subdued regional buying interest, with producers offering competitive prices to sustain volumes.
India may see the sharpest correction, as monsoon-related slowdown in construction and coating activities weighs on domestic consumption, while cautious need-based procurement keeps buyers on the sidelines.
Indonesia is expected to follow a similar softening trend, with muted manufacturing activity and steady import inflows adding to oversupply concerns, though prices may stabilize marginally towards the end of the quarter as restocking demand gradually resumes.
Global C10 Solvent Market Overview by Region (July–September 2026)
| Country | Grade/ Incoterm | Outlook |
| South Korea | Aromatic Wt% ≥ 99% FOB Busan | Mildly Bearish to Strongly Bearish |
| Indonesia | Aromatic Wt% ≥ 99% CIF Jakarta (South Korea) | Mildly Bearish to Strongly Bearish |
| India | Aromatic Wt% ≥ 99% CIF Nhava Sheva (South Korea) | Bearish to Strongly Bearish |
| India | Aromatic Wt% ≥ 99% Ex-Mumbai | Bearish to Strongly Bearish |
*C10 Solvent Forecast represents an analytical assessment based on information available at the time of publication. Actual market prices may vary due to unforeseen operational, regulatory, geopolitical, or economic developments.
Explore the Complete Price Watch™ C10 Solvent Forecast
Access comprehensive C10 Solvent market intelligence, including a 3-Month Rolling Forecast, 12-Month Price Forecast, forward price curves, country-wise market outlooks, procurement insights, and monthly forecast updates.
Explore Price Watch™ C10 Solvent Forecasts
What’s Included
The 3-Month Forecast (Updated Monthly)
It reflects changes in Crude oil and naphtha feedstock costs, energy prices, producer operating rates, plant outages, inventory levels, trade flows, freight rates, regional demand, and geopolitical developments affecting the global C10 Solvent market.
The 12-Month Forecast (Published Annually)
It provides a strategic outlook based on expected capacity additions, supply-demand balances, feedstock economics, macroeconomic conditions, industrial production trends, trade policies, seasonal demand patterns, and long-term supply chain developments, supporting procurement, budgeting, and strategic planning.
Our Proprietary Hybrid Forecasting Model Evaluates:
- Feedstock & production economics
- Plant operating rates & outages
- Inventory and supply-demand balance
- Regional trade flows & freight
- Import-export dynamics
- Macroeconomic & geopolitical developments
Track C10 Solvent Supply Disruptions in Real Time
As geopolitical risks continue to reshape global supply chains, stay ahead of the events that drive price movements by monitoring plant shutdowns, maintenance turnarounds, force majeure events, logistics bottlenecks, trade restrictions, and operational disruptions before they impact C10 Solvent markets.
Access the Price Watch™ GIO Tracker
C10 Solvent Price Trend Q2 2026
During the second quarter of 2026, the global C10 Solvent Price Index trended upward, though momentum eased as the quarter progressed. Average price increases ranged between 10% and 20% over the first quarter, driven by tightened naphtha-derived feedstock availability and elevated freight costs stemming from the Iran-Israel geopolitical tensions.
The C10 Solvent Price Chart showed prices holding firm through April, supported by cautious restocking and constrained logistics across rubber processing, industrial cleaning, and printing ink industries. As geopolitical conditions gradually normalized through May, buying sentiment cooled and cost pressures began to ease across markets.
By June 2026, the C10 Solvent Price Index softened broadly, reflecting improved feedstock supply and stabilizing freight conditions, signaling a wider shift toward balanced global demand-supply dynamics.
South Korea: C10 Solvent Export prices FOB Busan, South Korea; Grade- Industrial Grade (Aromatic Wt. 99% min)
In Q2 2026, the C10 Solvent price in South Korea increased by an average of 11% from the previous quarter, continuing the upward trend that began in March due to the geopolitical tensions between Iran and Israel.
In April, the C10 Solvent price trend in South Korea stayed stable, as reduced availability of naphtha-based feedstock and high freight expenses bolstered prices due to consistent demand from applications in paints, industrial cleaning, and printing ink.
As geopolitical conditions slowly stabilized throughout May, purchasing sentiment softened and cost pressures started to diminish. In June 2026, the C10 Solvent price in South Korea decreased due to enhanced feedstock availability from local naphtha crackers, reduced logistics constraints, and a steady transition toward more equilibrium in demand-supply dynamics within downstream solvent-using sectors.
Indonesia: C10 Solvent Import prices CIF Jakarta, Indonesia; Grade- Industrial Grade (Aromatic Wt. 99% min)
In Q2 2026, C10 Solvent prices in Indonesia experienced a 10% average increase as an importing country, driven by the ongoing effects of the Iran-Israel geopolitical tensions on global freight and feedstock expenses.
In April, the C10 Solvent price trend in Indonesia held steady, with increased shipping costs and careful restocking by manufacturers of rubber processing and industrial cleaning solvents sustaining upward pressure on landed costs.
As tensions lessened throughout May, purchasing sentiment stabilized and cost pressures started to alleviate. In June 2026, the C10 Solvent price in Indonesia declined further, indicating enhanced logistics, improved feedstock supply, and stabilizing demand throughout the region.
India: C10 Solvent Import prices CIF Jakarta, Indonesia; Grade- Industrial Grade (Aromatic Wt. 99% min)
In the second quarter of 2026, the C10 Solvent price in India as an importing nation surged by approximately 20% relative to the first quarter, influenced by limited feedstock availability and high freight expenses associated with the ongoing geopolitical conflicts between Iran and Israel.
In April, the C10 Solvent price trend in India remained steady, due to import restrictions, increased shipping expenses, and careful restocking by manufacturers in rubber processing and industrial cleaning, which maintained high landed prices.
As the geopolitical landscape slowly stabilized throughout May, cost pressures started to diminish. In June 2026, the C10 Solvent price in India decreased slightly, indicating enhanced supply chain conditions, greater vessel availability, and reduced freight-related cost pressures in the import market.