In Q1 2025, China’s n-Propanol export prices dropped to USD 1078/MT, reflecting a 10.68% decline compared to Q4 2024. The sharp decrease was driven by weak demand from key markets and higher inventory levels globally. While demand from the chemical and pharmaceutical sectors showed signs of slowing, a reduction in export volumes due to increased domestic consumption and logistical challenges exacerbated the price downturn. Compared to Q1 2024, the prices showed a significant dip, signaling a shift in market sentiment as buyers remained cautious amid global economic uncertainties and overcapacity in the supply chain.
In Q4 2024, n-Propanol export prices from China surged to USD 1207/MT, marking a 9.63% increase from Q3. The price rise was supported by higher demand from downstream industries, particularly in paints, coatings, and personal care products. Seasonal factors also played a role, with increased production and inventory restocking in major export regions like Europe and Southeast Asia. Despite the increase, concerns over logistical disruptions and potential price corrections in early 2025 kept a cautious outlook among traders. Compared to Q3 2024, this quarter displayed a strong recovery, providing much-needed relief for Chinese exporters.
In Q3 2024, China’s n-Propanol export prices rose to USD 1101/MT, showing an 8.30% increase over Q2. This upward movement was attributed to a rebound in demand from industries such as automotive, construction, and textiles, all of which require n-Propanol in varying applications. Global supply chains gradually recovered from earlier disruptions, supporting stronger export activity. However, rising raw material costs and freight rates slightly capped further growth. Compared to Q2’s minor decline, Q3 marked a period of stable growth, fueled by strong demand from both developed and emerging markets.
In Q2 2024, the price of n-Propanol exported from China stood at USD 1016/MT, a slight 0.38% decrease from Q1. This dip reflected a cooling off of the initial surge in demand seen in early 2024, as industries adjusted their procurement strategies after meeting their immediate requirements. The drop was also influenced by supply chain adjustments and lower-than-expected demand from key markets such as the Middle East and North America. While prices remained relatively stable compared to previous quarters, uncertainties surrounding global economic conditions kept the market from showing significant growth, contributing to the marginal decrease.
In Q1 2024, n-Propanol export prices from China increased to USD 1020/MT, reflecting a 1.52% rise compared to Q4 2023. The growth was driven by increased demand in the pharmaceutical and chemical sectors, as well as a slight rebound in the global economy after the New Year holiday period. As industries ramped up production and procurement, Chinese suppliers capitalized on the early-year momentum, offering competitive pricing while maintaining stable supply levels. This increase in pricing, while modest, indicated a positive start to the year, with more stability compared to the fluctuations seen in late 2023.
In Q1 2025, the CIF Nhava Sheva price of n-Propanol stood at USD 1158/MT, a 10.01% decrease from Q4 2024. Similarly, Ex-Bhiwandi prices were USD 1163/MT, reflecting a 4.73% increase from the previous quarter. The drop in CIF prices was influenced by a slowdown in demand, particularly from the chemical and pharmaceutical sectors. Despite the overall decline in CIF prices, the Ex-Bhiwandi price increase indicates stronger local market dynamics, likely due to domestic transportation and logistical factors. Both prices, however, showed mixed trends, with global and regional uncertainties impacting import pricing.
In Q4 2024, CIF Nhava Sheva prices of n-Propanol increased to USD 1287/MT, a 9.22% rise from Q3. However, Ex-Bhiwandi prices dropped to USD 1111/MT, marking a 19.92% decrease. The increase in CIF prices was largely driven by higher international demand, while the drop in local prices at Ex-Bhiwandi may reflect fluctuations in domestic supply or a reduction in local demand as stockpiles were adjusted. Despite the price disparity, the difference between CIF and Ex-Bhiwandi prices pointed to regional pricing dynamics, with fluctuations in local market conditions affecting the overall cost structure.
In Q3 2024, CIF Nhava Sheva prices for n-Propanol increased to USD 1178/MT, a 9.31% rise from Q2. Ex-Bhiwandi prices stood at USD 1387/MT, reflecting a 3.96% increase. The price hikes in both metrics were driven by stronger demand, particularly from the industrial and pharmaceutical sectors. The higher Ex-Bhiwandi price suggests that local suppliers capitalized on robust demand, increasing margins. The disparity between CIF and Ex-Bhiwandi prices could indicate an evolving supply chain dynamic, with domestic factors and regional production capacities influencing the final landed cost of n-Propanol in India.
In Q2 2024, CIF Nhava Sheva prices for n-Propanol stood at USD 1078/MT, showing a slight 0.24% increase from Q1. On the other hand, Ex-Bhiwandi prices increased more significantly to USD 1334/MT, a 15.78% rise. This sharp contrast reflects growing local demand, particularly in manufacturing sectors such as automotive and pharmaceuticals, pushing up domestic prices. The slight increase in CIF prices suggests relatively stable import conditions, but the significant rise in Ex-Bhiwandi prices emphasizes the impact of strong local market conditions, such as increased consumption and potential supply chain tightening.
In Q1 2024, CIF Nhava Sheva prices for n-Propanol were USD 1020/MT, reflecting a 1.52% increase from Q4 2023. Ex-Bhiwandi prices stood at USD 1152/MT, a 4.33% rise compared to the previous quarter. The increase in both CIF and Ex-Bhiwandi prices was indicative of steady demand in early 2024, despite global challenges in supply chains. While CIF prices showed moderate growth, Ex-Bhiwandi prices experienced a more significant rise, suggesting that local demand was picking up more than global import trends. This points to stronger domestic consumption driving price increases at the local level.
PriceWatch is your trusted resource for tracking global n-propanol price trends. Our platform delivers real-time data and expert analysis, offering deep insights into the key factors driving price fluctuations in the n-propanol market. By monitoring critical events such as geopolitical tensions, supply chain disruptions, and economic shifts, PriceWatch keeps you fully informed of market dynamics.
In addition, PriceWatch provides detailed forecasts and updates on production capacities, enabling you to anticipate market changes and make well-informed decisions. With PriceWatch, you gain a competitive edge in understanding all the elements that influence n-propanol prices worldwide. Stay ahead of the curve with PriceWatch’s reliable, accurate, and timely n-propanol market data.
Track PriceWatch's n-propanol price assessment on a weekly basis since 2015 onwards, along with short-term forecasts, and get access to the detailed report in a downloadable format.
Russia-Ukraine Conflict (2022-Present):
Supply Chain Disruptions: The conflict disrupted trade routes in Eastern Europe, causing logistical challenges for the transport of raw materials and finished chemicals like n-Propanol. Sanctions on Russia, a major energy and chemical exporter, limited access to petrochemical feedstocks essential for producing alcohols like n-Propanol.
Energy Prices and Feedstock Costs: The war led to volatility in crude oil and natural gas prices, which are primary feedstocks for n-Propanol production. Rising energy costs increased the operational expenses for chemical manufacturers globally, pushing up prices.
Demand-Supply Imbalance: Disruptions in industrial production in conflict-affected regions led to a supply shortage. Concurrently, increased demand for sanitizers, disinfectants, and cleaning agents during the pandemic sustained a high demand for n-Propanol, intensifying price pressures.
Economic Uncertainty: The conflict caused financial instability, affecting currencies, trade policies, and global economic growth, all of which influenced commodity pricing, including chemicals like n-Propanol.
COVID-19 Pandemic (2020):
Surge in Demand for Disinfectants and Sanitizers: n-Propanol is a critical ingredient in the production of sanitizers and disinfectants due to its antibacterial properties. The heightened demand for hygiene products led to a rapid spike in n-Propanol consumption, driving prices higher, especially during the early phases of the pandemic.
Supply Chain Disruptions: Lockdowns and restrictions across countries disrupted manufacturing, transportation, and distribution channels. This limited the availability of raw materials and finished n-Propanol, exacerbating supply shortages.
Fluctuations in Petrochemical Feedstock Prices: n-Propanol is derived from petrochemical processes, making its production cost-sensitive to fluctuations in crude oil prices. Early in the pandemic, crude oil prices plummeted due to reduced demand, temporarily lowering feedstock costs.
Shifts in Industrial Activity: Many industries using n-Propanol, such as coatings, printing inks, and solvents, faced slowdowns or shutdowns during lockdowns, reducing demand in these sectors. This created a dual market dynamic, with reduced industrial demand but surging healthcare-related demand.
Market Speculation and Hoarding: Panic buying and speculative stocking of n-Propanol by distributors and manufacturers amplified price volatility during the peak of the pandemic.
Geopolitical Tensions (2018-2019):
Trade Wars and Tariffs: The U.S.-China trade war-imposed tariffs on a wide range of goods, including petrochemical products and their derivatives like n-Propanol. Increased tariffs raised production costs for manufacturers in affected regions, leading to price hikes for downstream products like n-Propanol. Disruptions in trade routes and shifts in global sourcing caused supply-demand imbalances.
Oil Price Volatility: Geopolitical conflicts, including U.S. sanctions on Iran and tensions in the Middle East, led to fluctuations in crude oil prices. Since n-Propanol production relies on petrochemical feedstocks derived from crude oil, these price changes directly impacted its production costs and market prices.
Regional Instability: Political unrest in key regions, such as Venezuela (a major oil producer) and ongoing disputes in the Middle East, created uncertainty in the supply of raw materials. This instability led to inconsistent supply chains, pushing up costs for chemicals dependent on these resources.
Shifting Production Patterns: Geopolitical instability caused manufacturers to re-evaluate sourcing and production strategies, potentially leading to higher logistics and operational costs for n-Propanol producers.
Demand-Supply Fluctuations: Demand for n-Propanol remained stable in some industries, like coatings and inks, but supply disruptions and price volatility in raw materials caused unpredictable price movements.
This research methodology ensures that PriceWatch delivers the most accurate, timely, and actionable n-Propanol pricing assessments, helping our clients stay ahead of market trends and make informed business decisions.
Molecular Weight[g/mol]
CAS No
HS Code
Molecular Formula
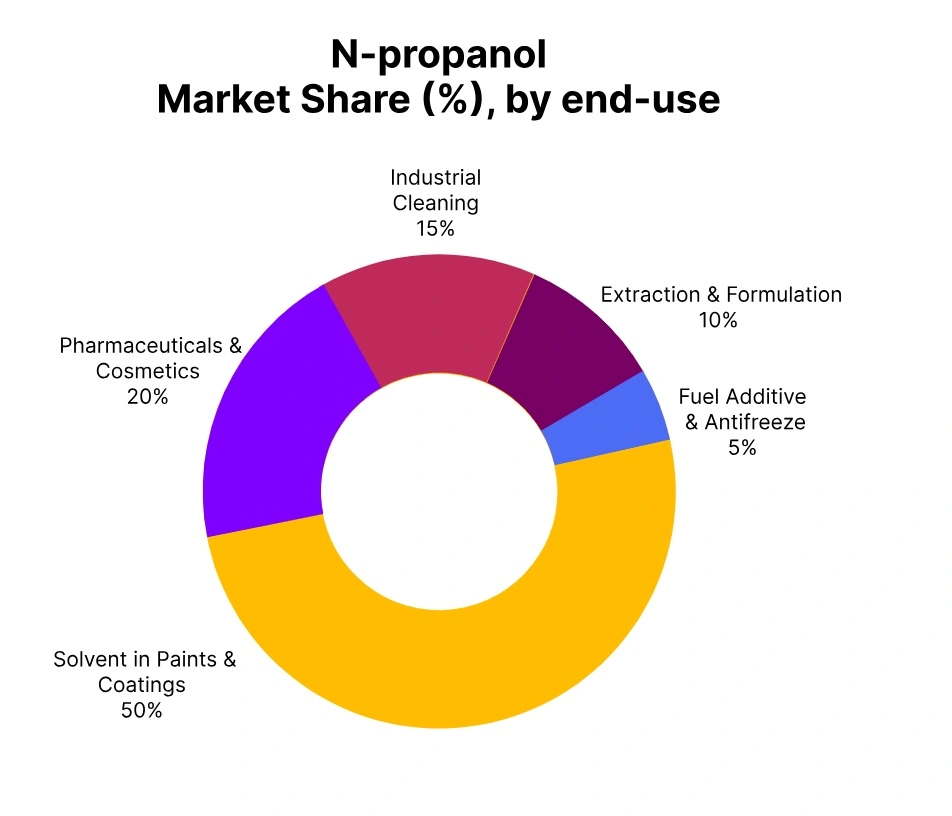
n-Propanol is a colourless alcohol primarily produced from propylene via direct hydration or oxo synthesis. Known for its mild odour and excellent solvency, it is widely used in coatings, printing inks, and cosmetics. As a versatile solvent and chemical intermediate, n-propanol plays a vital role in manufacturing pharmaceuticals, adhesives, and cleaning products, ensuring industrial efficiency.
Packaging Type
Grades Covered
Incoterms Used
Synonym
PriceWatch Quotation Terms:
Ex-Location: This incoterm refers to a shipping agreement where the seller makes the goods available at their premises, and the buyer is responsible for all transportation costs, including shipping, insurance, and any other fees.
CIF: CIF refers to the Cost, Insurance, and Freight (CIF) terms for goods. Under CIF terms, the seller is responsible for the cost of goods, insurance, and freight charges until the goods reach the port of destination.
FD: FD stands for Free Delivered where the seller takes full responsibility for delivering goods to the location/port. This ensures the buyer receives the goods at the designated port with all necessary costs, except import duties, covered.
FOB: FOB refers to the Free On-Board shipping term, where the seller is responsible for the cost and risk of delivering the goods to the port. Once the goods are on board the vessel, the responsibility shifts to the buyer for all costs, including shipping and insurance.
Property | Specification |
Appearance | Colourless liquid |
Purity | 99.5% |
Refractive Index | 1.39 |
Boiling Point | 96-98 °C |
Freezing Point | -127 °C |
Vapour Pressure (20 °C) | 14.5 mm Hg |
Specific Gravity | 0.8 |
Surface Tension (dynes/cm) | 23.8 |
Autoignition Temperature | 413 °C |
Applications
n-Propanol is used mainly as a feedstock/intermediate to make other chemicals including:
n-Propyl Acetate
Propylamines
Glycol Ethers
Esters and Plasticizers
The pricing of n-Propanol is influenced by several factors, including raw material costs such as propylene, fluctuations in supply and demand within industries like paints, coatings, and adhesives, as well as external elements like geopolitical events, trade tariffs, and energy prices. These factors combine to create variability in pricing depending on global economic conditions.
Regional production plays a significant role in n-propanol pricing. Regions with high production, like Asia-Pacific, tend to have more competitive pricing due to local availability, whereas regions that rely on imports, such as North America and Europe, often face higher costs due to transportation fees, import duties, and potential supply chain disruptions.
The latest pricing trends for n-propanol often reflect fluctuations in the cost of raw materials and changes in global supply chains. To secure better rates, procurement heads can consider locking in long-term contracts with suppliers, monitoring global price trends and indices, and optimizing bulk purchasing strategies to take advantage of volume discounts.
Copyright 2025. All rights reserved. Nidhyana Price Watch Data Analytics Private Limited