

Before you read: three questions this report answers
1) Why are rates out of Shanghai and Ningbo at 2026 highs when demand on some lanes is falling?
2) How can India’s exporters be short of ships when the storms are in China?
3) How much does a $4,000 jump in a container rate add to a tonne of polymer – before any feedstock moves?
Inside this report
1 The storm that never really ends – Four typhoons, one seven-week timeline
2 How bad is the queue? The numbers – 2.4M TEU stranded; berth waits up to 14 days
3 Freight rate volatility – China-origin spot rates on 7 lanes, ocean and air
4 The exporters who can’t export – Why India pays $11,000 for a box to New York
5 From freight to feedstock – ACN, toluene, PE/PP and TiO2 react first
6 What to watch next – Golden Week, Panama Canal, Saudel’s tail
Somewhere off the coast of Shanghai right now, roughly 90 container ships are sitting at anchor – some for more than a week – waiting for a berth that keeps getting pushed back. They are carrying polyethylene pellets, titanium dioxide, Iso-tanks of solvents and the packaging that half the world’s factories are waiting for.

1. The storm that never really ends
China’s east-coast gateways have not had a clean recovery window since mid-July 2026. Typhoon Bavi shut Shanghai and Ningbo in early July; Typhoon Noul hit the south-China ports in late July; Typhoon Dolphin – the strongest of the season – closed Ningbo-Zhoushan and Shanghai from 7–9 August and forced the evacuation of over 1 million people; and Typhoon Saudel made landfall in Zhejiang on 28 August, suspending Shanghai’s Yangshan and Waigaoqiao terminals and disrupting Busan in Korea.
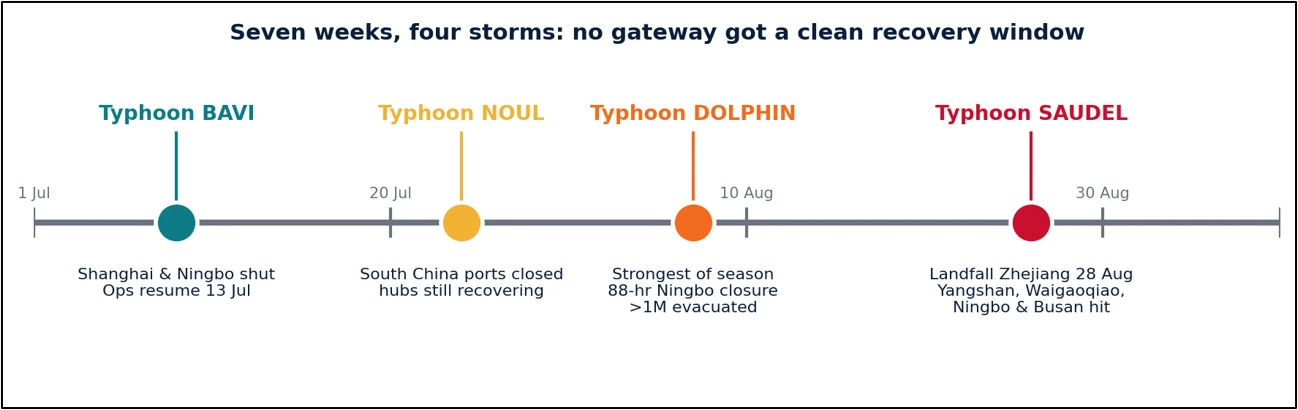
Figure 1 · Four typhoons in seven weeks – each arriving before the previous backlog had cleared, Source: Price Watch™
The problem is cumulative. Each storm arrives before the previous backlog has cleared, so vessels bunch, terminals hit yard-density limits and carriers begin skipping port calls entirely.
Table 1 · 2026 China typhoon disruption timeline
| Typhoon | Impact window | Ports affected | Key disruption metric |
| Bavi | Early July (ops resumed 13 Jul) | Shanghai, Ningbo | Multi-day suspensions |
| Noul | Late July | Shenzhen / South China | Hubs still recovering from Bavi |
| Dolphin | 7–11 August | Ningbo, Shanghai, Qingdao | ~88-hour Ningbo closure; >1M evacuated |
| Saudel | 26–28 August | Ningbo, Shanghai, Busan, Shenzhen (RISK) | Yangshan & Waigaoqiao shut; Ningbo gates closed from 26 Aug |
Source: Price Watch™
2. How bad is the queue? The numbers
Industry tracking puts more than 2.4 million TEU of vessel capacity tied up or delayed across North Asia – effectively a fleet-sized chunk of global container supply idling off China. Price Watch™’s port-dwell monitoring shows the delay has now spread beyond the storm zone into South China as diverted ships cascade through carrier networks.
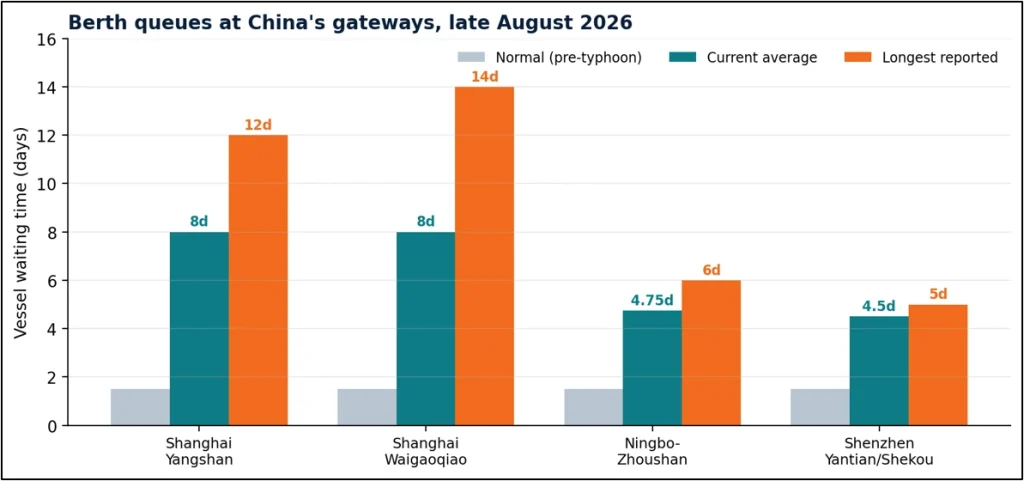
Figure 2 · Vessel waiting times versus a normal 1–2 day turnaround, Source: Price Watch™
Table 2 · Vessel waiting times at major Chinese gateways (late August 2026)
| Port / terminal | Normal wait | Current average | Longest reported | Export gate-in window |
| Shanghai – Yangshan | 1–2 days | 5–11 days | >12 days | ETB within 2–3 days |
| Shanghai – Waigaoqiao | 1–2 days | ~8 days | 10–14 days (US/SEA services) | ETB within 2–3 days |
| Ningbo-Zhoushan | 1–2 days | 3.5–6 days | Post-Saudel backlog building | ETB within 3 days |
| Shenzhen (Yantian / Shekou) | 1–2 days | 4–5 days | Rising as northern vessels arrive | ETB within 7 days |
Source: Price Watch™
Curious fact
Forwarders are now telling shippers to plan 15–20 days earlier than normal for China-origin ocean freight. End-to-end delays of 7–21 days are common on affected services – meaning a container booked today may sail after China’s October Golden Week blank-sailing period.
3. Freight rate volatility
Congestion is the hidden hand under this year’s unusually resilient peak-season pricing out of China. A 40ft box from Shanghai or Ningbo to the US West Coast now costs more than $7,600, up 2% last week to a fresh 2026 high; the same box to the US East Coast is close to $9,800. Even China–North Europe – where demand has clearly cooled – sits at about $4,600 per 40ft, roughly 70% above mid-May, because so much China-based tonnage is stuck at anchor rather than sailing.
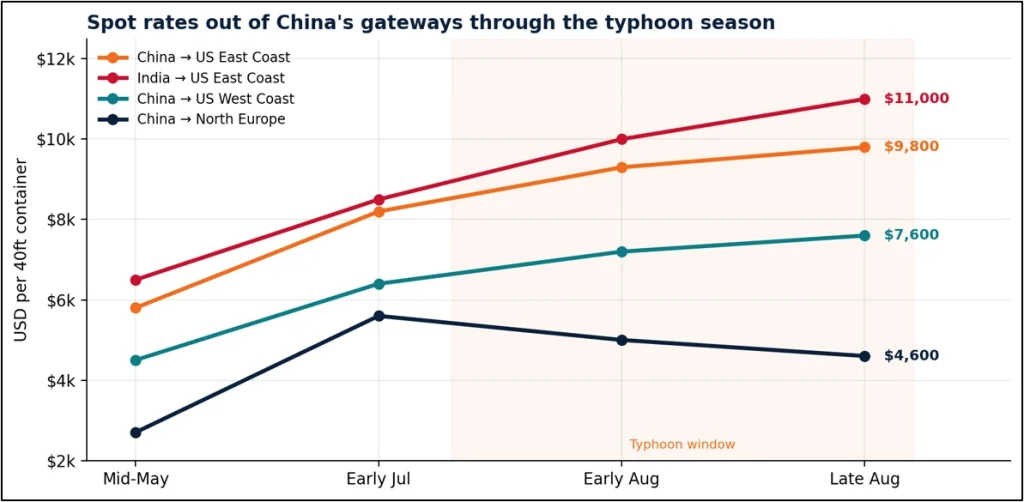
Figure 3 · Spot rates per 40ft container from China’s main gateways, indicative trend, mid-May to late August 2026, Source: Price Watch™
Table 3 · China-origin container spot rates tracked by Price-Watch.ai (week ending 29 August 2026)
| Trade lane | Current rate (per 40ft) | Weekly change | vs. mid-May 2026 | Comment |
| China (Shanghai/Ningbo) → US West Coast | $7,600+ | +2% | Peak-season high | Capacity being added for September |
| China (Shanghai/Ningbo) → US East Coast | ~$9,800 | +2% | Peak-season high | Panama Canal low-water surcharges coming |
| China → North Europe | ~$4,600 | −1% | +70% | Down >$1,000 from July peak, still elevated |
| China → Mediterranean | ~$4,800 | −4% | +40% (3-month) | Down >$2,000 from peak |
| N. Europe → US (Transatlantic) | ~$2,600 | +$400 in 2 weeks | – | Ships pulled to cover China lanes |
| Air: China → N. America | ~$6.00/kg | −7% | >+20% y/y (global index) | Trending up again this week |
| Air: China → N. Europe | ~$4.60/kg | +1% | – | Typhoon-driven demand spike |
Source: Price Watch™
4. The exporters who can’t export
Here is the twist most buyers miss: the shortage is not confined to China. When 2.4 million TEU of ships are parked off Zhejiang, those vessels and their empty containers are not rotating back through India, Southeast Asia or the Middle East. Exporting nations that should be gaining share from China’s disruption simply cannot find boxes or berths.
India is the clearest case. Spot rates from India to the US East Coast have reached $10,000–12,000 per 40HC. Peak-season surcharges averaged $5,000 per 40HC in August, and at least one major carrier has lifted its PSS to $7,500 per 40HC from 1 September. Forty-foot high-cube equipment is inconsistently available at JNPT/Nhava Sheva, Mundra and Hazira, while monsoon conditions add vessel bunching and rail delays on the west coast.
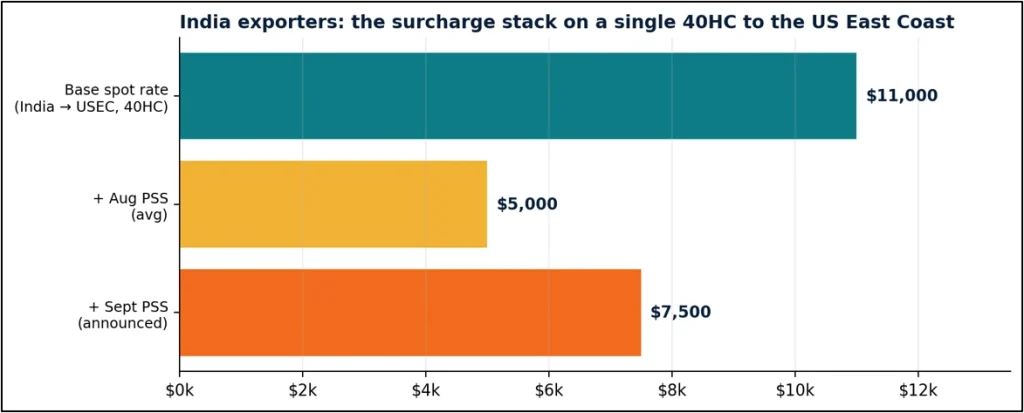
Figure 4 · Base rate plus surcharge layers on an India → US East Coast 40HC, Source: Price Watch™
Table 4 · India export freight snapshot (September 2026)
| Metric | Value | Trend |
| India → USEC spot rate (40HC) | $10,000–12,000 | ▲ Rising |
| Average Peak Season Surcharge (AUG) | ~$5,000 / 40HC | ▲ Rising |
| Announced PSS from 1 Sept | up to $7,500 / 40HC | ▲▲ Sharp rise |
| 40HC equipment availability | Inconsistent at 3 major gateways | ▼ Deteriorating |
| Rollover / schedule reliability | Deteriorating | ▼ Deteriorating |
Source: Price Watch™
5. From freight to feedstock
Containers matter to the chemical industry more than most realise. Polymers such as PE and PP travel as pellets in boxes; titanium dioxide moves in containers; liquid chemicals ride in isotanks. When those boxes stop moving, prompt availability tightens and sellers reprice.
Table 5 · Early chemical price responses to logistics disruption (East China, August 2026)
| Product | Price move | Level | Driver |
| Acrylonitrile (ACN), ex-tank | +CNY XXX/tonne | CNY XXX/tonne | Typhoon logistics disruption; near-term supply concerns |
| Toluene (ASIA) | Sentiment support, firmer offers | – | Reduced port activity, slower cargo flows |
| PE / PP resin (China export) | Landed cost up | +$XXX–XXX/tonne on freight alone* | Shanghai/Ningbo box rates to US & Europe |
| TiO2 (containerised) | Delivery slippage 1–3 weeks | – | Rolled cargo, port omissions |
*Price Watch™ estimate based on ~20 tonnes per 40ft container against current spot-rate deltas versus mid-May. Source: Price Watch™
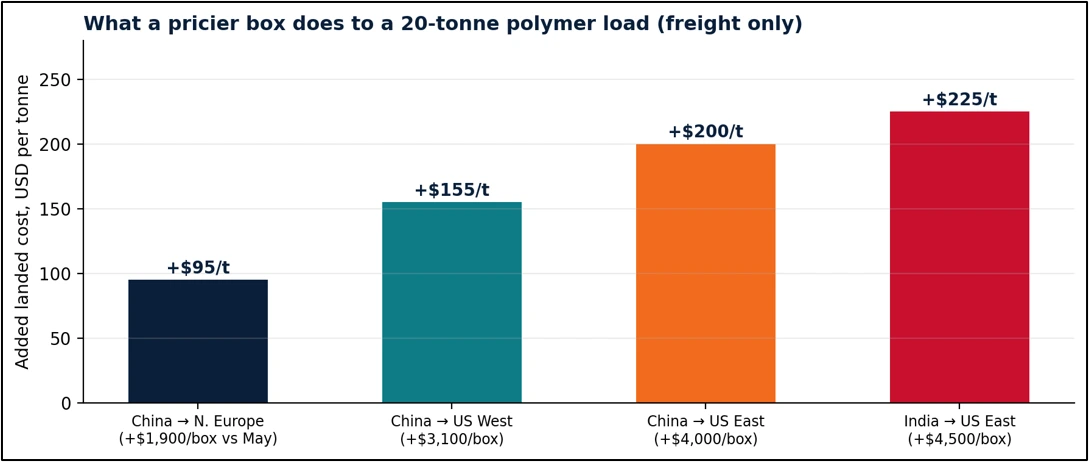
Figure 5 · Freight-only cost added per tonne of polymer since mid-May, by lane, Source: Price Watch™
The arithmetic buyers forget
A $3,100 rise in the Shanghai → US West Coast box rate since May adds about $155 per tonne to a 20-tonne polymer load – before a single molecule of feedstock gets more expensive. On China → US East Coast it is roughly $200/tonne, and on India → US East Coast about $225/tonne.
6. What to watch next
- Golden Week blank sailings: carriers are already cancelling October capacity around China’s national holiday, which will slow backlog clearance.
- Panama Canal surcharges: low-water restrictions bring new September surcharges that land hardest on US East Coast and Gulf rates.
- Saudel’s tail: the storm may still clip Shenzhen this week, threatening Yantian and Shekou where queues are already 4–5 days.
Stay ahead of the next surcharge – with Price Watch™
Price Watch™ tracks freight charges, port dwell times and raw-material prices in near real time, so procurement teams can see the cost of a container – and the chemicals inside it – before the invoice arrives. In a season where the weather is setting the price, that visibility is the only forecast that pays.
Follow Price Watch™ on LinkedIn for weekly Sugar price trends, regional benchmarks, import-flow intelligence, policy developments, and global commodity market updates.