

A tyre looks like a single object. On the factory floor, it is closer to an assembly line of chemistry decisions, each one a line item on a Bill of Materials that a procurement team has to defend every quarter.
Peel back the tread and you find layers of natural rubber and synthetic elastomer wrapped around belts of steel cord, reinforced with nylon and polyester fabric, bound together by carbon black, silica, insoluble sulphur, and zinc oxide.
Prices climbed, briefly stabilised, and then declined sharply. For procurement teams, the period became a constant balancing act between factory floor requirements and rapidly changing commodity markets.
What Actually Goes into a Tyre
Strip away the branding and a passenger radial breaks down into a handful of functional families, each doing a job no substitute material performs quite as well.
Elastomers form the base polymer matrix. Natural rubber supplies flexibility and heat resistance that synthetic alternatives still cannot fully replicate, particularly in the tread and sidewall of larger commercial tyres.
Synthetic rubber fills in where natural rubber falls short: styrene-butadiene rubber (SBR) for tread wear and grip, polybutadiene rubber (PBR) for abrasion resistance and low rolling resistance, nitrile rubber (NBR) for oil resistance in specialty applications, and EPDM for sidewall weathering and ozone resistance.
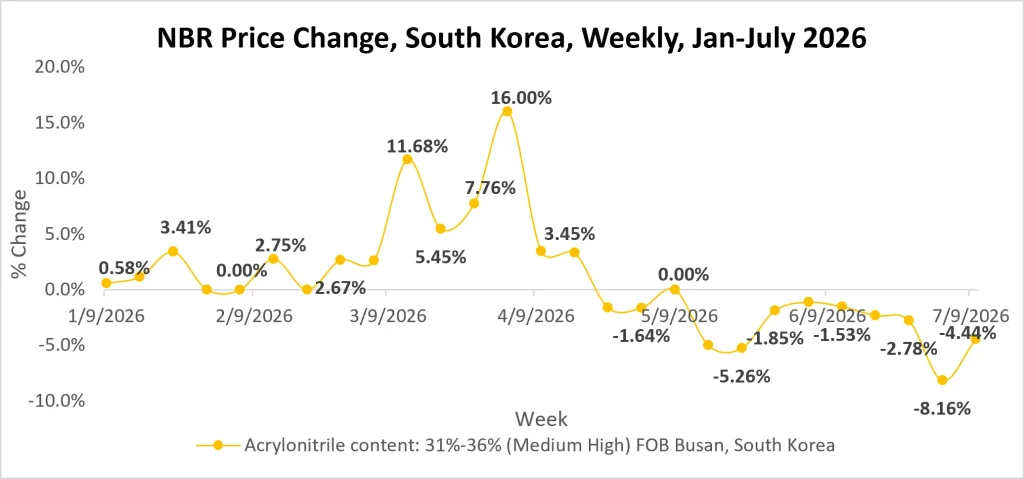
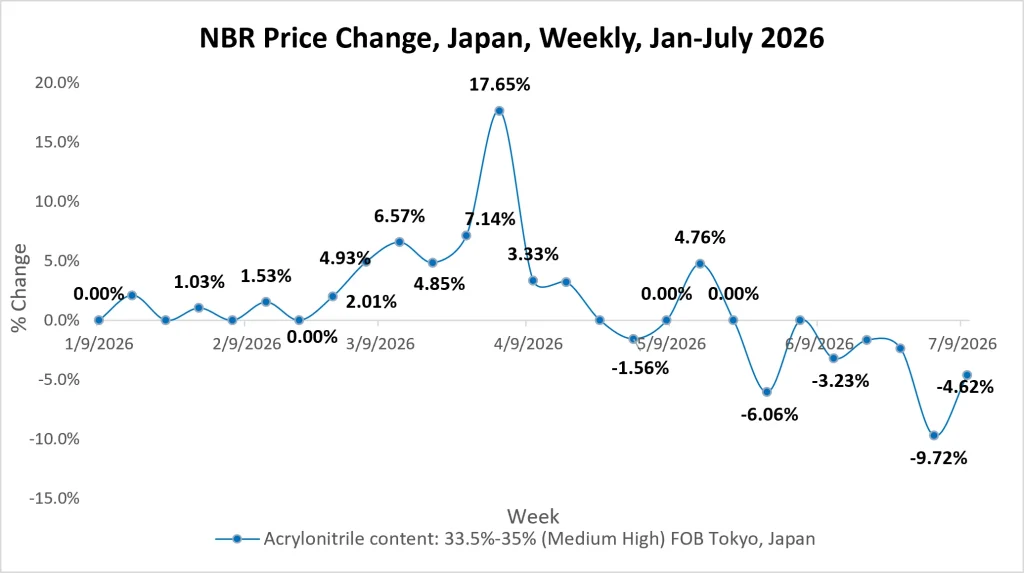
Source: Price Watch™ NBR Prices
Reinforcements give the tyre its shape and structural integrity under load. Steel cord belts sit beneath the tread to resist puncture and maintain contact patch stability at speed. Nylon and polyester tyre cord fabric form the carcass plies, the skeleton that keeps a tyre round under inflation pressure and cornering loads.
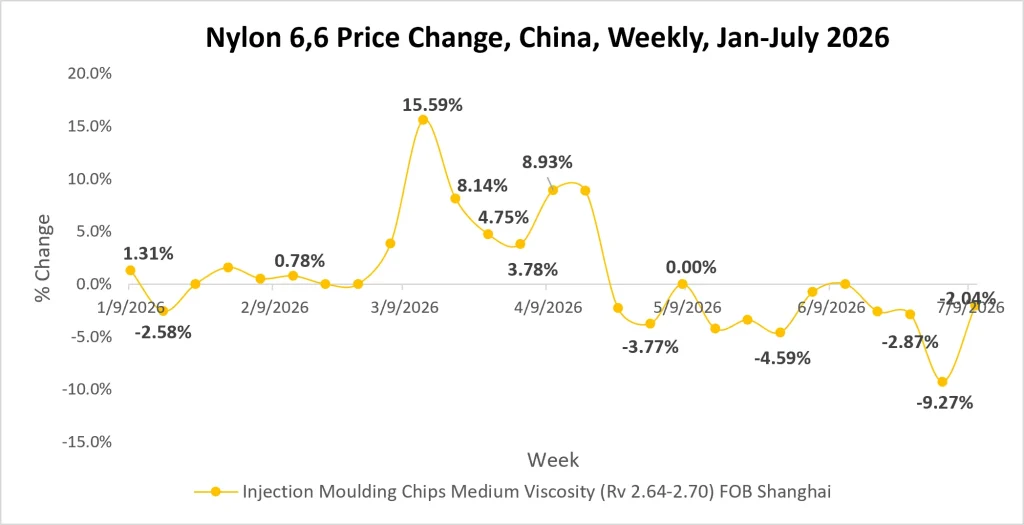
Source: Price Watch™ Nylon 66 Prices
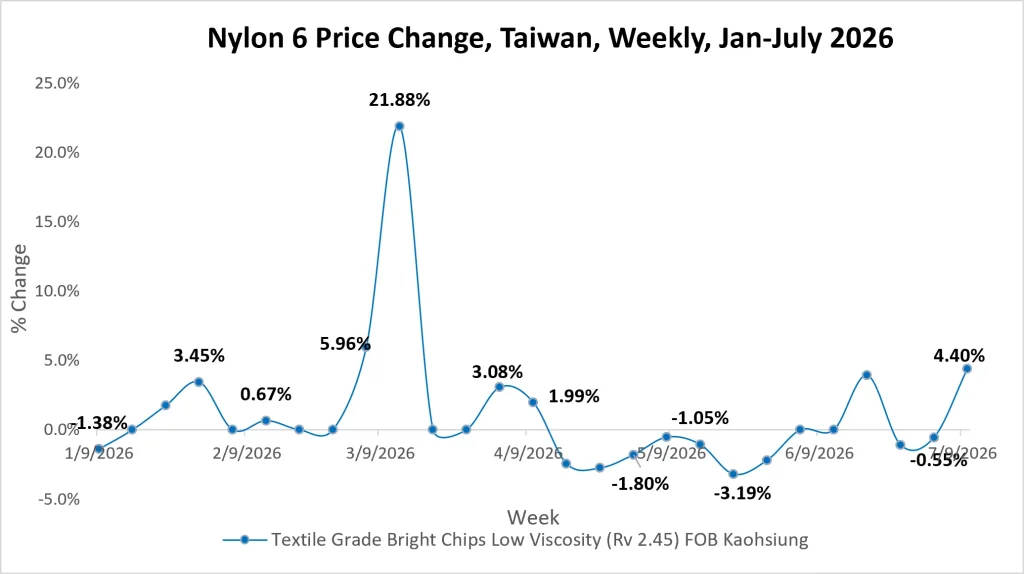
Source: Price Watch™ Nylon 6 Prices
Chemicals and additives do the quieter engineering work. Carbon black reinforces the rubber matrix and provides abrasion resistance, silica reduces rolling resistance and improves wet grip, insoluble sulphur cross-links the rubber during vulcanization, and zinc oxide activates that cross-linking process while adding heat resistance.
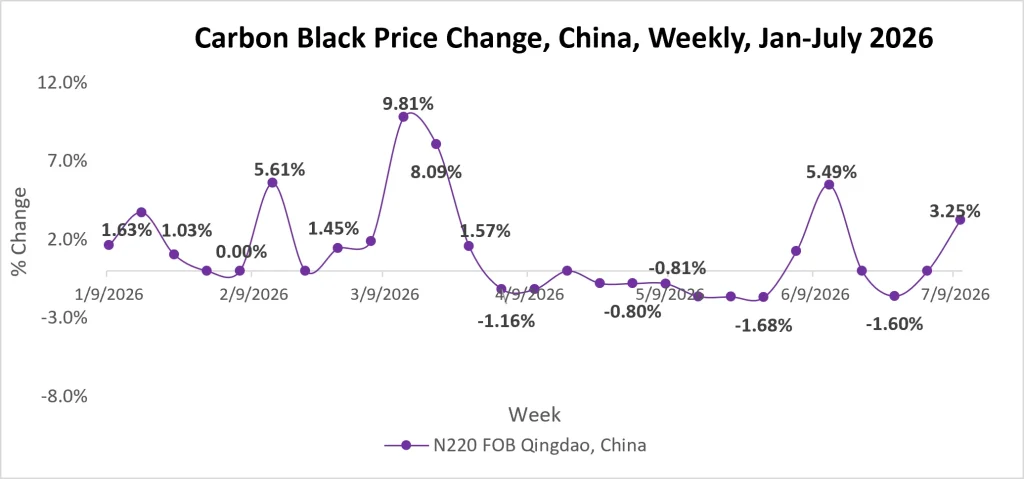
Source: Price Watch™ Carbon Black
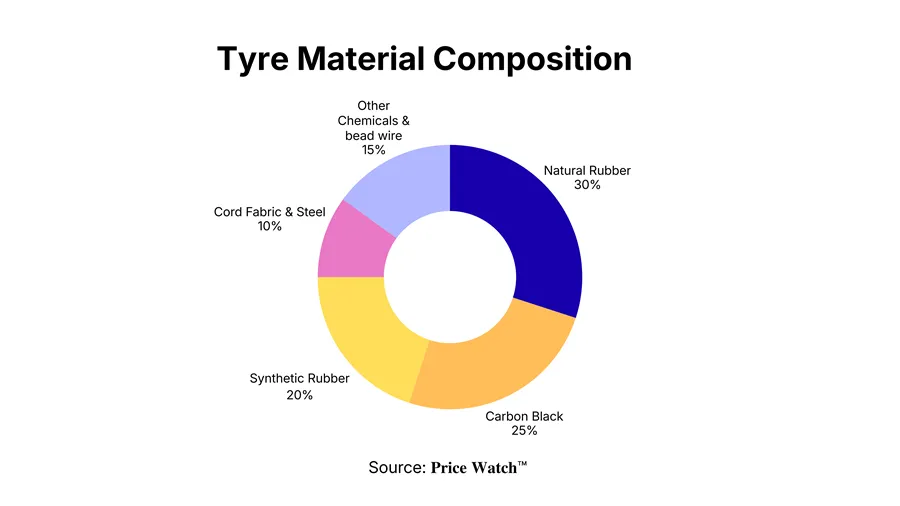
According to figures the Automotive Tyre Manufacturers Association (ATMA) has shared with Indian industry analysts, natural rubber makes up roughly 30% of the input mix by volume, carbon black around 25%, synthetic rubber close to 20%, and cord fabric near 10%, with the remainder split across bead wire, chemicals, and processing oils.
That volume split matters less than the cost split, though, because these materials are not priced equally. And in the first half of 2026, the gap between those two numbers is exactly where the trouble started.
The Six Months That Broke the Cost Model
Every procurement calendar has a rhythm. Early 2026 followed a familiar one. Natural rubber held firm through Q4 2025 into Q1 2026, supported by tight supply out of Southeast Asia after flooding disrupted Thai output, the world’s largest producing nation.
Carbon black traded in a narrow band. Synthetic rubber tracked crude oil the way it always does, quietly.
Then, in the back half of the first quarter, the Iran-Israel conflict escalated and disrupted shipping through the Strait of Hormuz, one of the world’s most critical energy chokepoints.
Brent crude jumped from roughly $72.48 a barrel on February 27 to $108.65 by March 19, a climb of nearly 50% in three weeks. That single move rippled through every crude-linked input on a tyre manufacturer’s purchase order.
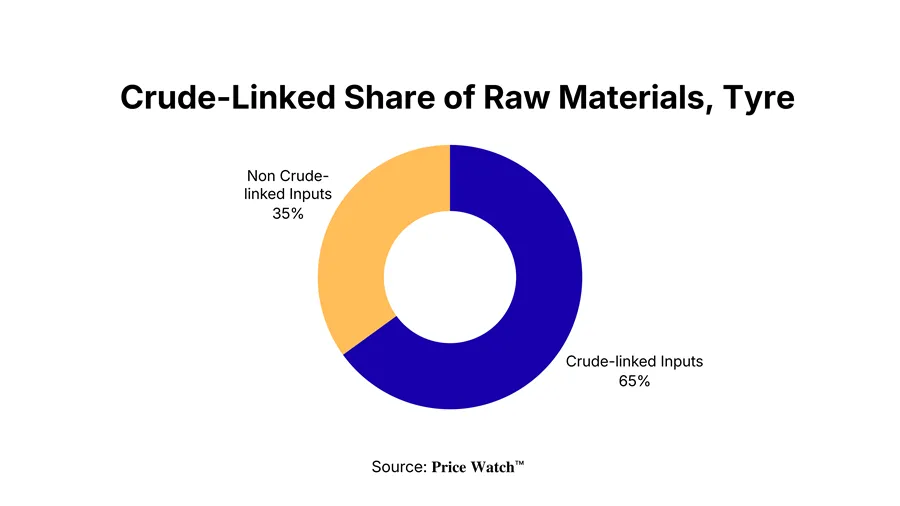
The transmission chain was almost textbook: crude oil into naphtha, naphtha into butadiene and styrene, those feedstocks into synthetic rubber and rubber chemicals, and from there straight into the cost of every tyre rolling off a production line.
Industry reporting from March 2026 pegged the cumulative damage at carbon black rising as much as 25%, synthetic rubber climbing close to 40% at its peak, and crude itself up roughly 50%.
Cabot’s China operations raised rubber carbon black prices twice within three weeks, first by RMB 800 per ton, then by RMB 1,800 per ton on specialty grades. Orion Engineered Carbons followed with hikes reaching 25%.
Flexsys added a surcharge on insoluble sulphur across Asia, citing the same conflict-driven spike in energy, freight, and feedstock costs. Silica in North America moved up 6.5% quarter over quarter on the back of tightening logistics.
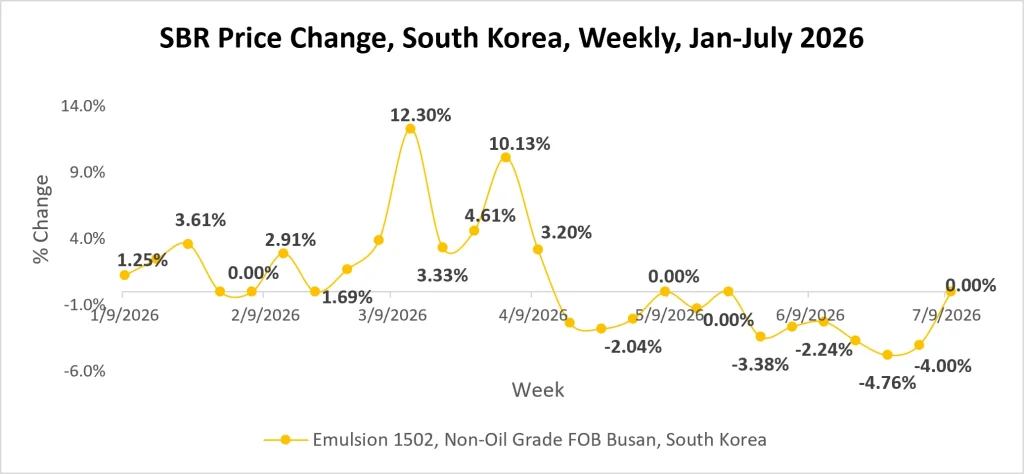
Source: Price Watch™ SBR
Natural rubber, not directly crude-linked but globally substitutable with synthetic rubber, rode the same wave for a different reason. Northeast Asian prices climbed nearly 15% between Q4 2025 and Q1 2026.
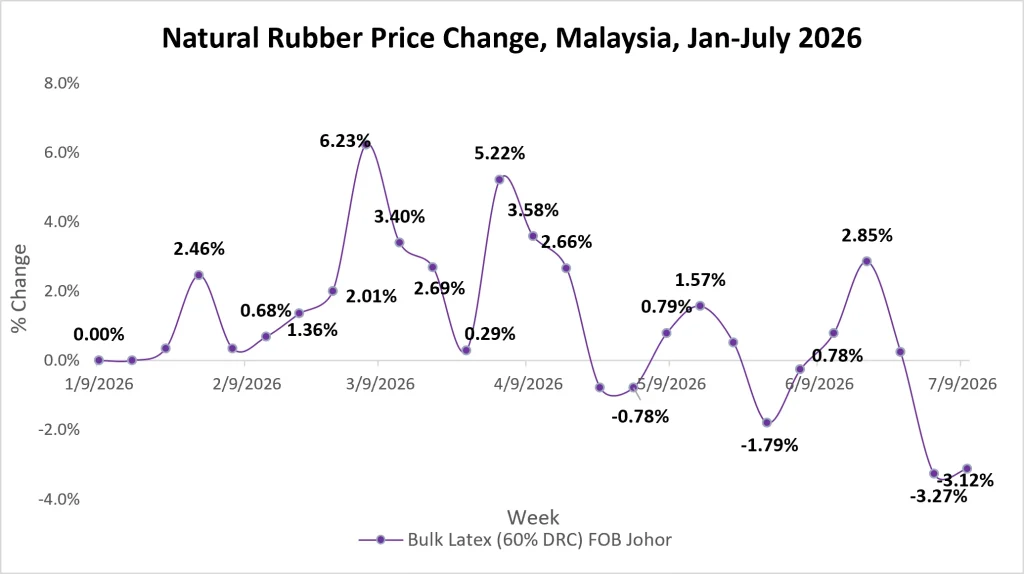
Source: Price Watch™ Natural Rubber Prices
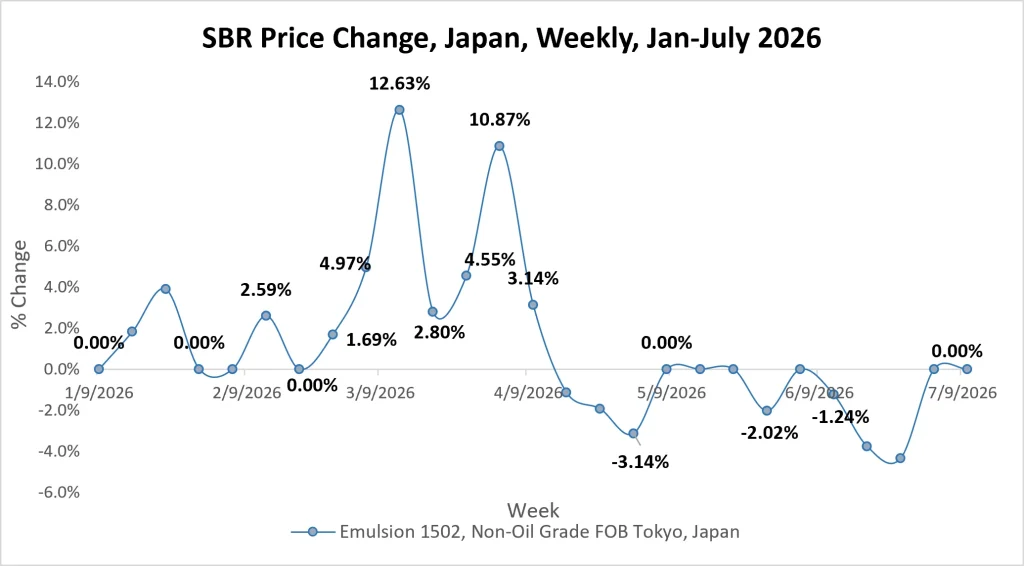
Source: Price Watch™ SBR
By March 2026, nearly 70 tyre manufacturers worldwide, from Pirelli and Goodyear to Zhongce, Sailun, and Linglong, had issued more than 80 separate price increase notices. This was not one company reacting to one supplier. It was an entire industry’s cost base shifting under it at once.
“Crude oil derivatives, including synthetic rubber, carbon black, processing oils, polyester or nylon tyre cord fabric, make up an estimated 60-70% of total raw material cost, making tyre makers acutely sensitive to oil swings.”
That line, from ATMA’s own assessment of the Indian industry, is the entire second act of this story compressed into a single sentence.
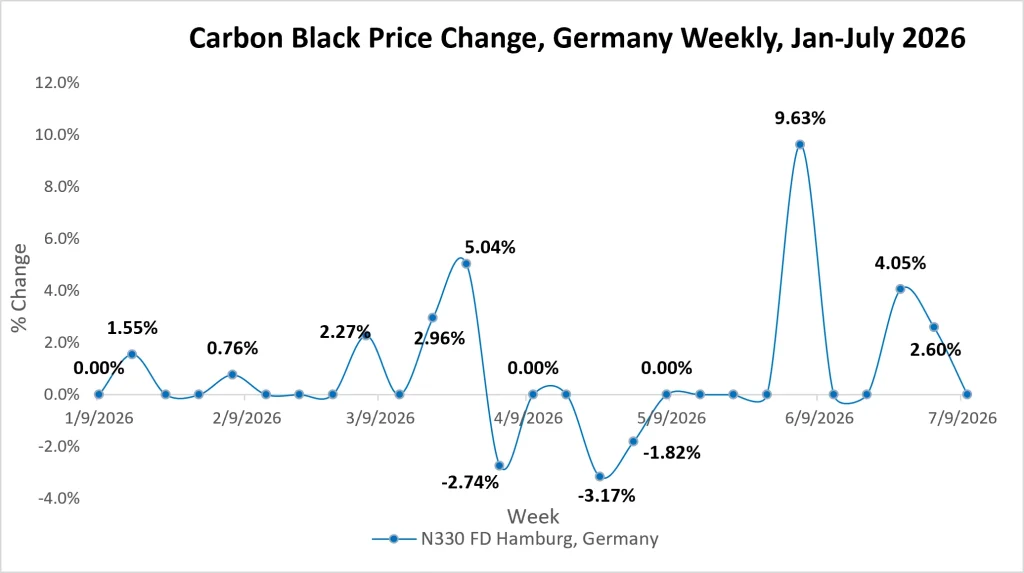
Source: Price Watch™ Carbon Black
The Squeeze
Here is where the story stops being about commodity charts and starts being about a procurement director’s Monday morning.
Raw materials typically account for roughly half to two-thirds of a tyre’s total production cost, which means a 20-40% swing in synthetic rubber or carbon black does not stay contained in a single line item. It moves straight through gross margin.
JK Tyre’s management disclosed that key inputs, natural rubber, synthetic rubber, carbon black, and steel, together represent roughly two-thirds of the company’s total expenditure, and that those inputs had climbed more than 20% year on year.
The company responded with a cumulative price hike of 11-13% across the year, including a further 5-6% increase planned by September 2026. Apollo Tyres and CEAT followed comparable paths.
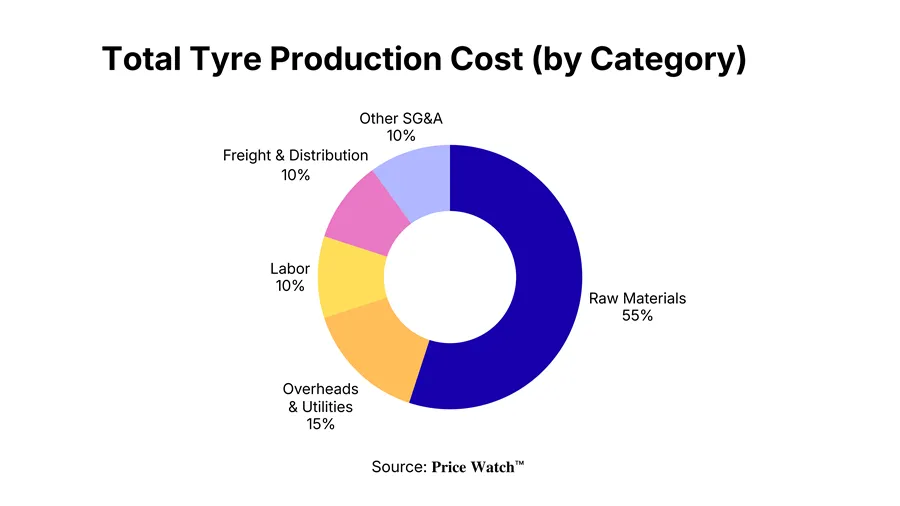
The squeeze has a specific anatomy, and it is worth naming its parts because each one behaves differently under pressure.
Cost rigidity is the first problem. A tyre manufacturer cannot substitute its way out of a carbon black spike overnight; reformulating a compound means requalifying it against performance, safety, and OEM specifications, a process that takes months, not weeks. The input mix is close to fixed in the short run even when its price is not.
Contract bottlenecks are the second, and this is where the pain concentrates. Replacement-market pricing can move relatively quickly, tyre manufacturers adjust list prices and dealer margins on a rolling basis. Long-term OEM supply agreements are a different equation entirely.
Automakers negotiate annual or multi-year fixed-price contracts, and unwinding those terms mid-cycle is neither fast nor guaranteed. This is the mechanism ATMA and its member companies have flagged repeatedly: replacement customers absorb some of the increase through list price adjustments, but OEM-bound volume often has to be absorbed internally until the next contract renegotiation window opens.
Currency exposure compounds both. For India specifically, a weakening rupee against the dollar adds a second layer of cost on top of the underlying commodity move, since a large share of tyre precursors are either imported outright or priced in dollar-denominated global benchmarks.
One industry cost breakdown attributed close to a fifth of a recent ₹100-per-kg cost impact directly to currency depreciation rather than commodity price alone, on top of the roughly 30% swing in production cost that the combined pressure represented for a standard passenger or truck radial.
Export markets added a final complication that had nothing to do with input costs and everything to do with geography. CEAT reported that West Asia, worth an estimated 15% of its international business, saw sales fall to “practically zero” during the worst of the conflict.
Apollo Tyres flagged similar disruption across its European logistics routes. For an industry where exports carry a turnover ratio of 26-27%, among the highest of any Indian manufacturing sector, a regional conflict became a demand-side shock layered directly on top of a cost-side shock.
How Procurement Teams Are Managing Volatility
None of this caught sophisticated procurement teams flat-footed, because none of it was genuinely unprecedented. The 2022-23 raw material spike was worse in magnitude, pushing costs up more than 40% and denting margins for five to six consecutive quarters. What is different this time is how manufacturers are managing the exposure.
Staggered contract laddering replaces single-point annual negotiations with rolling, overlapping purchase commitments across quarters, so no single spike lands on 100% of open volume at once.
Dual and triple sourcing across natural rubber origins, particularly diversifying beyond any single Southeast Asian producing nation, reduces exposure to weather or political disruption in one geography.
Index-linked pass-through clauses in OEM contracts, increasingly common in newer agreements, let manufacturers adjust pricing against published commodity benchmarks rather than renegotiating from scratch every time crude moves.
Inventory positioning ahead of known seasonal risk windows, monsoon disruption to natural rubber tapping, pre-holiday feedstock volatility, lets treasury and procurement teams buy ahead of anticipated tightness rather than chasing price after the fact.
And crucially, phased pricing action rather than one large correction. Analysts consistently note that a single steep price hike risks demand destruction, so manufacturers spread increases across multiple smaller announcements, testing elasticity as they go.
The Road Ahead for Raw Material Markets
The market has also started giving some of that margin back. By Q2 2026, crude eased off its March peak, SBR prices in China corrected strongly between April and May, and natural rubber futures drifted back toward normal range by early July as Southeast Asian output entered its seasonal upswing and Chinese auto demand softened, with passenger vehicle sales in China falling for nine consecutive months and the China Passenger Car Association revising its 2026 sales forecast down to an 11% decline.
Crisil’s own read on the Indian sector is that raw material costs have begun cooling, and that manufacturers who have already pushed pricing through will not roll it back, meaning margins should improve through the remainder of the fiscal year.
Which raw materials deserve the closest monitoring going forward? Synthetic rubber and carbon black remain the two most crude-sensitive lines on the BOM and the ones most exposed to any renewed Middle East volatility.
Natural rubber carries weather risk every monsoon season regardless of geopolitics. Insoluble sulphur, a smaller line item by cost but a critical one for steel-belt adhesion, has shown itself willing to move sharply on feedstock disruption even when broader elastomer markets are calm.
What This Means on the Ground in India
On the cost side, India imports 35-45% of its natural rubber requirement, mostly from Indonesia, Vietnam, and Thailand, which keeps domestic pricing tethered to international benchmarks regardless of local harvest conditions.
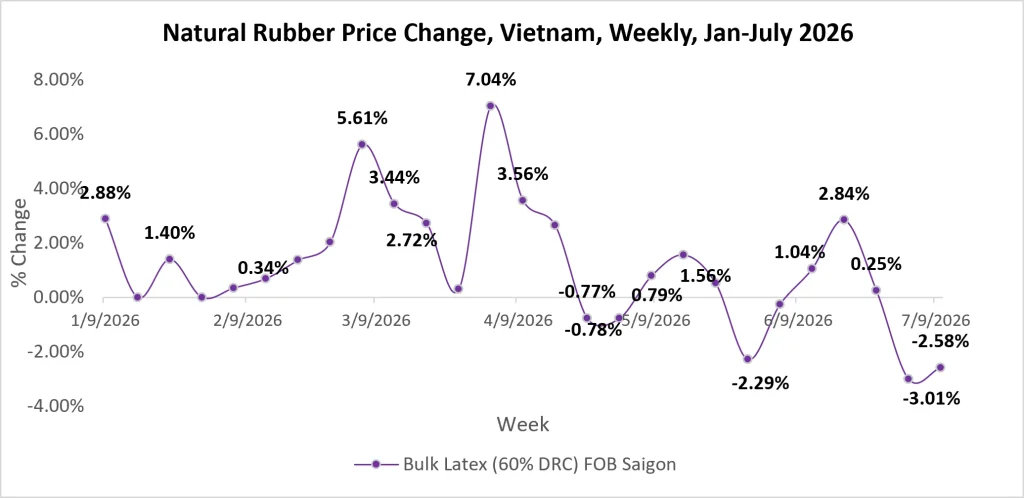
Source: Price Watch™ Natural Rubber Prices
Natural rubber imports are also restricted to entry through only two ports, Chennai and Nava Sheva, a limitation in place since January 2016 that ATMA has been actively lobbying to lift, arguing it adds unnecessary friction precisely when the industry can least absorb it.
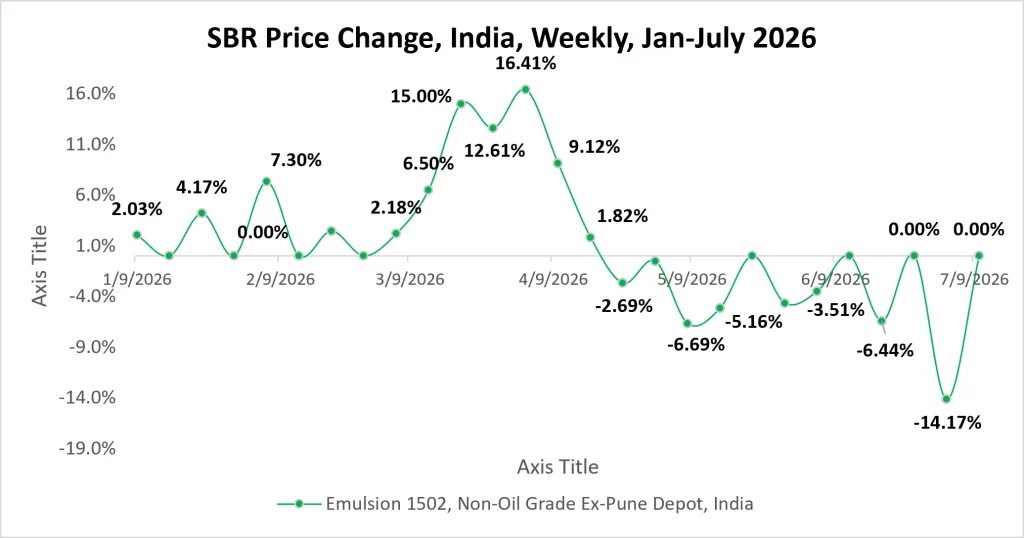
Source: Price Watch™ SBR Prices
On customs duty, the government granted a temporary exemption on select raw materials, including PBR, SBR, and certain resins, but that relief is currently scheduled to lapse on June 30, 2026.
ATMA is pushing for an extension through March 2027, alongside relief on duties still applied to polyester and nylon tyre cord fabric, steel tyre cord, and processing oils, none of which currently enjoy the same exemption.
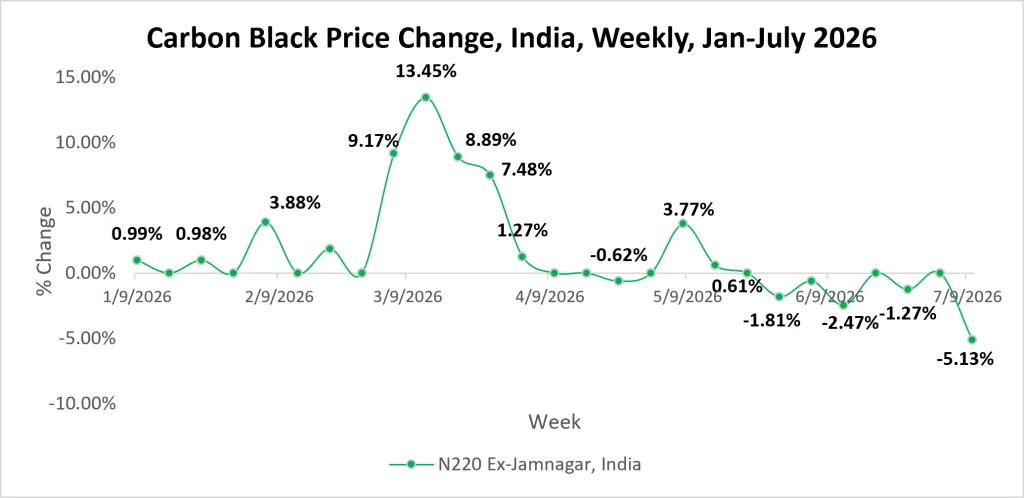
Source: Price Watch™ Carbon Black Prices
On the demand side, the picture is more encouraging. GST on tyres now sits at 18%, and the recent rate rationalization has supported lower retail prices even as input costs rose, a rare instance of tax policy and commodity policy pulling in opposite directions at the same time.
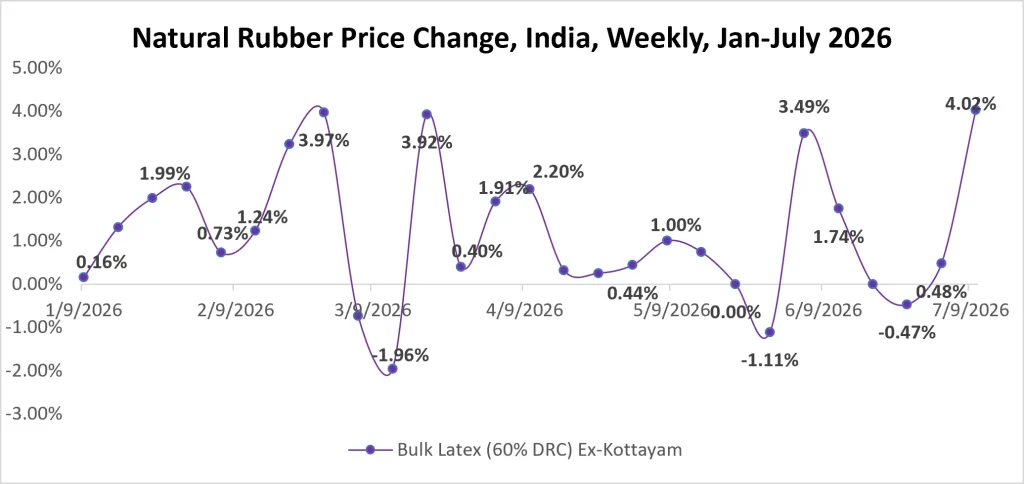
Source: Price Watch™ Natural Rubber
ICRA projects industry-wide volume growth of 5-7% for the coming year, helped by healthy rural cash flows and rising disposable incomes, and Crisil expects growth in the higher single digits.
Indian tyre exports crossed ₹27,000 crore in FY26 for the first time, up 9% year on year, even after absorbing the West Asia disruption.
From Market Trends to Procurement Decisions
So could rising raw material costs translate into further tyre price revisions in India specifically? The math suggests yes, but with a caveat that matters for anyone reading a purchase order right now.
Manufacturers have already pushed through cumulative increases in the 11–13% range this year, with more phased action into Q3.
Whether that holds or reverses depends on three variables moving in parallel: how durable the current cooling in crude and synthetic rubber proves to be, whether the rupee stabilizes against the dollar, and whether the government extends customs relief past its June deadline.
None of those three is fully within a procurement team’s control, and none of them is fully predictable from a quarterly index report either.
That is precisely the gap between static benchmarking and something built for how this industry actually buys. A tyre manufacturer’s margin does not move on a monthly average.
It moves on the week Cabot announces a second hike in three weeks, on the day the Rubber Board prints an all-time high, on the shipping notice that says a route through Hormuz just got more expensive to insure.
Six months of the year proved that the companies who moved fastest were not the ones with the best forecast. They were the ones with the freshest number in front of them when the decision had to get made.
Want to stay ahead of the next price move instead of reacting to it?
Price Watch™ gives procurement teams timely visibility into raw material cost shifts, supplier price revisions, and market-moving events, so every buying decision is backed by the latest available intelligence, not last month’s averages.
Follow Price Watch™ on LinkedIn for real-time raw material insights, pricing trends, supply chain intelligence, and market updates shaping global commodity markets.