

This market advisory examines the emerging supply and delivery risks in India’s chemical market, where constrained effective vessel availability is increasing replacement-cost pressure despite no broad-based shortage in global production.
The analysis assesses how these logistics constraints could influence Indian chemical prices over the coming weeks, with the impact expected to vary across products.
Particular attention is given to import-dependent chemicals, products with limited substitution options, and markets operating with thin inventory cover, where supply disruptions are more likely to translate into significant price movements. The advisory also outlines the resulting procurement considerations for buyers as market conditions evolve.
How the Vessel Shortage Is Reshaping India’s Chemical and Petrochemical Market
Executive Summary
India’s chemical market is increasingly being shaped by logistics as much as by conventional production and demand. The latest “vessel shortage” is best understood as a shortage of usable shipping capacity on the required route, date and cargo class.
Route diversions, port queues, blank or omitted sailings, equipment imbalances and restrictions on dangerous goods cargo reduce the number of reliable voyages available to chemical importers even when the global fleet itself has not contracted.
The transmission to Indian prices has been sequential. Freight, bunkers, insurance, storage and financing have been repriced first. Physical availability tightens next as delayed cargoes reduce distributor and consumer inventories.
Domestic producers and traders have gained pricing power as buyers shift toward immediately available stock and local production. Import dependence determined structural exposure, while inventory cover and downstream demand determine the timing and scale of the price response.
If reduced effective vessel availability persists over the coming weeks, this sequence is expected to maintain an upward price bias, led by the most import-sensitive products.
The supplied balance identifies EPDM, styrene and EVA as the clearest direct exposures because India has no meaningful current production base for these markets, POE is also structurally import-led. NBR, PVC, PBR and halo butyl rubber form the next tier because imports close a large domestic deficit.
Products such as PP, LLDPE, polystyrene, SAN and PET have been better protected in aggregate, but specialized grades and imported feedstocks keep them connected to the same maritime shock.
The Vessel Shortage Behind the Price Story
The shortage is operational, not numerical
A growing global fleet does not guarantee capacity on the route, date and cargo class required by an Indian chemical buyer. A vessel waiting outside a congested port, following a longer route around a high-risk corridor, or arriving too late for its reserved berth window completes fewer voyages.
Carriers may then roll bookings, consolidate services, omit ports or reduce the number of dependable weekly slots. Nominal capacity can therefore appear adequate while effective India-bound capacity becomes scarce.
Chemicals experience a narrower constraint than general cargo. Dangerous goods shipments require carrier approval, accurate documentation, compatible stowage and port acceptance.
Bulk liquids such as styrene require chemical-tanker capability or tank containers and suitable terminals. Even containerized polymers can be delayed when clean boxes, ISO tanks, flexitanks or approved DG slots are unavailable. General freight space is therefore not equivalent to usable chemical space.
Route disruption is transmitted through India’s gateways
The supplied draft points to three connected pressure points: disruption around the Strait of Hormuz, continued uncertainty on Red Sea-linked routes, and congestion across major Asian and Indian ports.
Gulf disruption has delayed petrochemical and feedstock cargoes directly. Red Sea diversions have absorbed vessels for longer voyages and raised fuel and insurance exposure. Congestion at Asian origin hubs has, further, slowed departures, while bunching at Indian destinations tied up berths, equipment and yard capacity.
For Indian importers, these effects have converged at west-coast gateways such as Mundra, Hazira and Nhava Sheva/JNPA. Material may be physically available at plants in China, South Korea, Southeast Asia or the Gulf; however, it has become commercially scarce in India because the correct ship or equipment cannot reach the right port at the expected time. Figure 1 places these origin corridors and Indian gateways in a single operational view.
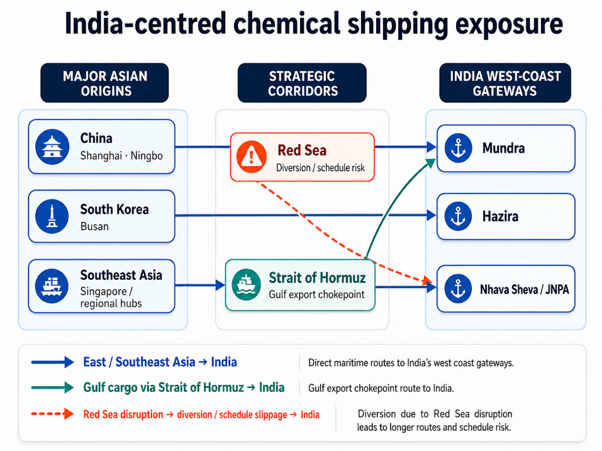
Figure 1. India-centered chemical shipping exposure: major Asian origins, strategic chokepoints and India west-coast gateways. Source: Price Watch™
How a Vessel Delay Becomes a Higher Chemical Price
Freight is only the first layer of the price effect. Once schedules become unreliable, importers begin pricing the risk of replacement. A distributor selling older inventory knows that the next parcel may arrive later, carry a higher freight and insurance bill, or require more working capital before it can be discharged and sold.
Quotations, therefore, begin to reflect expected replacement cost rather than only the historical cost of material already in the warehouse.
| Transmission channel | What changes first | Likely effect in India |
| Restricted vessel space | Planned cargo cannot load on time | Prompt material earns a premium and buyers compete for available parcels. |
| Port congestion | Longer origin or destination dwell time | Demurrage, detention and financing costs increase. |
| Equipment shortage | Containers and ISO tanks circulate more slowly | Loading is delayed or equipment premiums rise. |
| Schedule unreliability | Arrival dates become uncertain | Importers raise safety stocks and shorten quotation validity. |
| Blank / omitted sailings | Scheduled capacity disappears | Imports become irregular and short-term shortages become sharper. |
| Energy and feedstock inflation | Bunker, crude, LNG or insurance costs rise | Production and transport costs can increase together. |
Source: Price Watch™
This mechanism can move prices before a statistical shortage appears. Importers may continue to hold physical stock, yet they become less willing to sell large volumes at the old price because replenishment has become more expensive and less predictable. The first visible symptom is often shorter quotation validity, smaller offered quantities or a widening premium for prompt cargo.
Mapping India’s Structural Import Exposure
The severity of the shipping shock is not the same for every chemical. The key question is how much of Indian demand can be covered by domestic production when imports are delayed.
The following balance consolidates the supplied capacity, production, trade and demand figures across synthetic rubbers, styrenics, solar and specialty polymers, the polyester/vinyl chain and polyolefins.
India supply-demand balance
| Product | Capacity | Production | Imports | Exports | Demand | Import dependence |
| EPDM | 0 | 0 | 75.26 | 1.43 | 73.82 | 100% |
| NBR | 18 | 16.2 | 50.37 | 0.89 | 65.68 | 77% |
| SBR | 270 | 242 | 92 | 9 | 325 | 28% |
| Butyl Rubber | 120 | 116 | 58 | 26 | 148 | 39% |
| Halo Butyl Rubber | 60 | 51 | 46.75 | 5.73 | 92.03 | 51% |
| PBR | 135 | 132 | 134 | 2 | 264 | 51% |
| Styrene | 0 | 0 | 1,400 | 0 | 1,400 | 100% |
| Polystyrene | 400 | 302 | 51 | 36 | 317 | 16% |
| SAN | 175 | 150 | 20 | 0 | 170 | 12% |
| ABS | 270 | 210 | 105 | 0 | 315 | 33% |
| EVA | 15 | 0 | 300 | 2 | 298 | ~101%* |
| MEG | 2,705 | 2,168 | 1,127 | 24 | 3,271 | 34% |
| PTA | 6,830 | 6,490 | 1,800 | 0 | 8,290 | 22% |
| PVC | 1,672 | 1,576 | 3,096 | 0 | 4,672 | 66% |
| PET | 2,613 | 2,111 | 312 | 311 | 2,112 | 15% |
| LDPE | 650 | 618 | 494 | 27 | 1,085 | 46% |
| LLDPE | 4,330 | 3,110 | 694 | 229 | 3,575 | 19% |
| HDPE | 1,780 | 2,764 | 921 | 136 | 3,549 | 26% |
| PP | 7,020 | 6,619 | 1,329 | 338 | 7,610 | 17% |
Data note: Volumes are in Thousand tonnes per year (KTPA), Source: Price Watch™
Import dependency is the first exposure filter
The above table shows the gross role of imports in each market, but products with meaningful exports can look more exposed than the quantity that remains in India.
The chart below therefore uses a net import-dependency series to show the share of apparent domestic demand ultimately reliant on inward seaborne supply after allowing for outbound trade. The ranking is most useful as a structural guide rather than a short-term price forecast.
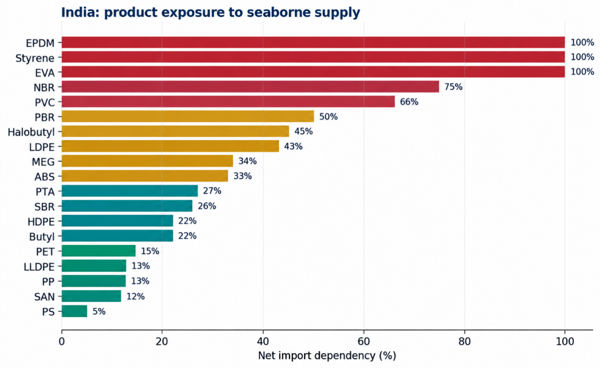
Figure 2. India: product exposure to seaborne supply and uses net import-dependency rates. Source: Price Watch™
Exposure ranking and the product connection
| Risk level | Products | Connection to vessel shortage |
| Critical | EPDM, styrene, EVA | No effective domestic production; delayed vessels directly reduce Indian availability. |
| High | NBR, PVC, PBR, halo butyl; selected ABS grades | Imports close a large balance or supply technically approved grades. |
| Moderate-high | LDPE, MEG, ABS, PTA, butyl | Domestic supply exists, but import parity and feedstock/logistics costs remain influential. |
| Moderate / grade-specific | SBR, HDPE, LLDPE, PP, SAN, polystyrene, PET | Aggregate production offers protection; specialized grades and imported feedstocks remain exposed. |
Source: Price Watch™
Import dependence alone does not determine price risk. The ability to substitute a grade or supplier is equally important: products that combine high import dependence with difficult substitution are the most vulnerable when vessel schedules weaken.
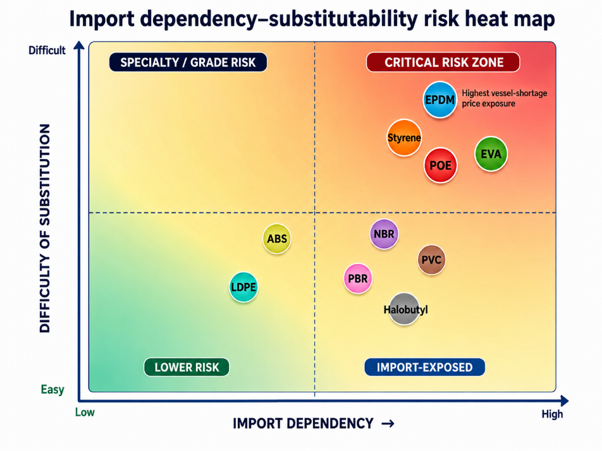
Figure 3. Import dependency-substitutability risk heat map: products in the upper-right zone combine high import reliance with difficult substitution and therefore carry the strongest vessel-shortage exposure. Source: Price Watch™
This ranking is dynamic. A moderate product can temporarily become high-risk when a domestic plant is under maintenance, several buyers restock together, a specialized grade is unavailable or inventories fall below minimum cover.
Conversely, a highly import-dependent product may remain stable for several weeks when distributors hold sufficient stock and downstream demand is weak. Structural exposure identifies where the risk sits; inventory and demand decide when it becomes visible.
Product-Group Exposure: Where the Shipping Shock Lands First
Synthetic rubbers and elastomers
EPDM has the fastest and most direct shipping-to-price connection. With no domestic production in the supplied balance, Indian consumption completely depends on seaborne arrivals or inventory already in the country.
The risk is amplified by grade qualification: ethylene content, oil extension, viscosity and application approvals mean that one supplier’s grade cannot always be replaced immediately by another. Automotive seals, hoses, roofing membranes, cable insulation and industrial profiles can therefore face a grade-specific shortage before the national tonnage balance looks tight.
NBR is the next major concern. Domestic production is small relative to demand, leaving imports to meet roughly three-quarters of the market in the supplied balance. PBR and halo butyl rubber also require substantial imported supply.
Halo butyl is particularly sensitive because tyre and pharmaceutical-closure applications commonly require approved grades, while PBR demand is large relative to its domestic production base.
SBR and general butyl rubber have stronger domestic cushions, so the first effect is more likely to appear through import-parity pricing and specialised grades than through an immediate market-wide shortage.
The vulnerability begins with styrene
Styrene is structurally critical because the above balance shows no domestic production and about 1.4 million tonnes of annual requirement. It must arrive by chemical tanker or equivalent approved liquid-bulk logistics.
Its importance extends well beyond the monomer market: styrene is a principal input for polystyrene and SAN, combines with acrylonitrile and butadiene in ABS, and is also linked to SBR and other styrenic elastomers. A delayed styrene cargo can therefore influence several downstream markets at once.
Polystyrene and SAN are comparatively protected by domestic production, while ABS carries greater finished-resin import exposure and more grade differentiation. In appliances, electronics and automotive components, colour, impact performance and flame-retardant specifications can make specialised ABS grades more vulnerable than the headline import ratio suggests.
The styrenics chain is therefore exposed both directly through imported resin and indirectly through imported monomer replacement cost.
Low substitutability raises the logistics premium in EVA and POE
EVA illustrates why nameplate capacity alone can give a false sense of security. The above data shows 15 KTPA of installed capacity but zero production against demand close to 300 KTPA, leaving the Indian market heavily dependent on imports.
Footwear, foam, cable and adhesive users all depend on consistent grade availability, but the exposure is particularly acute in solar encapsulation, where qualification requirements can make buyers prioritize supply continuity over price.
Because EVA is consumed at industrial scale, air freight is not a practical alternative during prolonged shipping disruptions. Reliability of vessel rotations, container availability and port schedules therefore becomes an important part of replacement cost.
Any delay in imported cargoes can tighten prompt availability and increase the premium buyers are willing to pay for material already positioned in the domestic market. POE carries a similar qualitative exposure in specialised solar and elastomer applications, where limited grade interchangeability can make continuity of imported supply especially important.
PVC and the polyester chain
PVC is the standout direct risk in this group. Imports account for about two-thirds of the supplied demand balance, so prolonged vessel disruption can tighten availability quickly when domestic plants are already running at high rates.
Import offers also act as an important reference point for domestic negotiations, meaning that higher replacement freight can pull local offers upward before the market reaches an absolute shortage.
MEG and PTA sit in the moderate-exposure band, but both are major feedstocks for polyester. A delayed MEG tanker or PTA cargo can raise the marginal cost of PET, Polyester fibres and other downstream polyester products even when finished-product availability remains relatively comfortable.
PET is comparatively less exposed because India has a large domestic production base, but it is not fully insulated from maritime disruption. Around 15% of domestic PET requirements are met through imports, leaving part of the market directly exposed to vessel availability, freight costs and delays in replacement cargoes.
At the same time, changes in MEG and PTA costs, export economics and regional logistics can influence domestic PET offers. As a result, shipping disruption can affect PET through both direct imported-material exposure and indirect feedstock-cost pressure.
Stronger domestic protection, but not complete immunity for Polyolefins
Polyolefins are generally better protected by Indian production. LDPE is the most exposed of the major grades, with imports meeting a substantial share of demand. LLDPE and PP have large domestic production bases, while HDPE is also comparatively well supplied in aggregate.
For these products, the first pressure is likely to be concentrated on differentiated grades, regional stock imbalances and import-parity offers rather than an immediate nationwide shortage.
The above HDPE production figure exceeds stated nameplate capacity, which may reflect debottlenecking, multi-line output or a mismatch between capacity and production reference bases.
Price Transmission Is Sequential, Not Immediate
A vessel shortage rarely produces one instant percentage increase. In practice, the Indian market moves through three overlapping stages. The speed of the sequence depends on stock cover: a well-stocked market may remain calm through the first stage, while a low-inventory market can move quickly from logistics repricing to physical tightening.
| Stage | What changes | Indian price effect |
| 1. Logistics repricing | Freight, bunker, insurance, storage and financing rise; quotation validity shortens. | New import offers rise first while older warehouse stock may still trade near previous levels. |
| 2. Physical tightening | Rolled cargoes and late arrivals reduce distributor and consumer inventories. | Prompt premiums widen; sellers ration quantities and technically approved grades become harder to source. |
| 3. Domestic repricing | Buyers shift toward local plants and immediately available stock. | Indian producers and traders gain pricing power and offers move closer to import replacement cost. |
Source: Price Watch™
The same mechanism can be read as a flow: logistics is repriced first, inventories then tighten as arrivals are delayed, and domestic offers finally adjust as buyers compete for prompt material. Stock cover determines how quickly one stage feeds into the next.
The visible price jump can therefore occur after the operational shock rather than on the day the first vessel is delayed. Importers may initially absorb part of the freight increase or continue selling older inventory.
The stronger move begins when delayed arrivals accumulate, stock cover falls and several buyers return to the market at the same time. At that point the market shifts from a freight story to a prompt-availability story.
Demand, Inventory, Currency and Working Capital Decide the Size of the Increase
Demand controls pass-through
Import dependence determines exposure, but downstream demand determines how much of the logistics cost can actually be passed through. Automotive and tyre industries are central for EPDM, NBR, SBR, PBR and butyl rubber.
Strong vehicle production, replacement-tyre demand and industrial output give suppliers more room to transfer higher landed costs. Weak production schedules slow the pass-through but do not eliminate grade-specific risk.
Footwear demand matters for EVA, NBR and SBR and is generally more price-sensitive. Appliances, electronics and consumer durables influence polystyrene, SAN and ABS, while solar-module production is especially important for EVA and POE because project commitments and qualification requirements can make continuity more important than spot price.
Construction demand determines how quickly PVC and HDPE costs move into pipes, profiles, cables and infrastructure products.
Inventory is the bridge between vessel delay and domestic price
High stock cover postpones the shortage; low stock cover makes even a brief disruption significant. Large consumers may initially draw on safety stocks, while smaller processors remain more dependent on distributors.
Once coverage falls below operating minimums, buyers who previously resisted higher quotations can return to the market together, creating a step-change in spot prices and a sharper premium for prompt material.
Currency and working capital amplify the logistics shock
Longer transit and dwell times keep importers’ cash tied up for longer. Letters of credit, supplier payments, insurance and interest accrue before the cargo can be discharged and sold.
Smaller traders may reduce parcel sizes or temporarily pause imports, concentrating available material among larger participants.
A weaker rupee adds another layer because international chemical trade and freight are largely dollar-denominated: INR depreciation raises Indian replacement cost even when the overseas product quotation is unchanged.
Chemical Market Outlook
Short term
In the coming weeks, reduced effective vessel availability is expected to keep Indian chemical prices on an upward bias, although the increase should remain uneven across products. The strongest response should remain concentrated in markets where India has little or no effective domestic fallback.
EPDM, styrene and EVA sit at the top of that list, with POE also structurally exposed. NBR, PVC, PBR and halo butyl are likely to strengthen when cargo delays coincide with low inventory. Selected ABS grades can behave similarly when approved alternatives are limited.
SBR, butyl rubber, polystyrene, SAN, MEG, PTA and the major polyolefins should show a more differentiated response. Their domestic production provides a buffer, but it does not isolate them from higher imported feedstock costs, import-parity pricing or shortages in specific grades.
Wider price dispersion between sellers is likely because quotations increasingly reflect each importer’s own next-cargo cost and expected arrival date.
Medium term
If disruption lasts several months, the effect broadens from imported chemicals into domestic manufacturing. Local producers gain enquiries and negotiating power, yet some of those producers also face higher imported feedstock, energy and logistics costs.
Downstream manufacturers are then pushed toward longer contracts, additional safety stock, origin diversification and formulation changes where technical approvals permit.
New Indian capacity in EPDM, EVA, POE or other strategically exposed products could reduce vulnerability over the long run, but investment, commissioning and customer qualification cannot resolve an immediate logistics shock. In the medium term the more practical adjustment is supply-chain diversification rather than rapid capacity substitution.
What could intensify or reverse the increase
| Upside risk | Expected effect |
| Further restriction of Strait of Hormuz traffic | Higher energy, tanker, insurance and Gulf freight costs. |
| Renewed Red Sea security deterioration | Longer routes and greater global vessel absorption. |
| Severe Indian or Chinese port congestion | More delays, equipment shortages and vessel bunching. |
| Rupee depreciation | Higher landed cost for dollar-denominated imports. |
| Overseas plant shutdowns | Production shortage compounds the logistics shortage. |
| Blank sailings during peak demand | Reduced space and sharper prompt-delivery premiums. |
Source: Price Watch™
| Easing factor | Likely consequence |
| Normalization of Gulf shipping | Lower war-risk and routing premiums. |
| Improved Asian port productivity | Better schedule reliability and equipment circulation. |
| Delayed cargoes arriving in clusters | Temporary oversupply and pressure on spot prices. |
| Weak automotive, footwear or appliance demand | Slower cost pass-through. |
| Rupee appreciation | Lower import replacement costs. |
| Buyer resistance and destocking | Importers absorb part of the logistics increase. |
Source: Price Watch™
A continuous one-way rise is therefore not guaranteed. Better route security, improved port productivity or restored vessel rotations could lower freight and risk premiums.
Delayed cargoes can also arrive together and briefly create excess inventory. The more defensible expectation is elevated and uneven volatility rather than a uniform percentage increase across all chemicals.
Monitoring Dashboard for Indian Buyers
Global freight indices alone are not enough to identify when a logistics disruption is turning into chemical inflation. Buyers need route-specific operating signals alongside product inventories, domestic plant rates and downstream demand.
The most useful warning indicators are those that reveal a loss of effective transport capacity or a decline in local stock cover before the price move becomes fully visible.
| Indicator group | What to watch | Why it matters |
| Shipping operations | Vessel waiting time; schedule reliability; blank sailings; port omissions; rolled cargo. | Shows whether effective transport capacity is improving or deteriorating. |
| Chemical logistics | DG acceptance; ISO-tank availability; chemical-tanker space; container/equipment circulation. | Determines whether confirmed material can actually be loaded. |
| Cost signals | Lane freight; bunker/LNG; war-risk insurance; demurrage; USD/INR. | Translates operational disruption into landed replacement cost. |
| Product balance | Importer stocks; overseas outages; Indian operating rates; grade availability. | Shows how much physical protection remains once arrivals are delayed. |
| Demand | Tyres/autos; footwear; appliances/electronics; solar; construction and packaging. | Determines the ability of suppliers to pass higher costs downstream. |
Source: Price Watch™
For practical market surveillance, these indicators can be combined into a single operating dashboard. The stress monitor below links shipping reliability, port delay, currency and inventory signals with the products most exposed to import disruption.
A combination of weakening schedule reliability, elevated waiting times, tighter product inventories and rupee pressure would reinforce the likelihood of further price increases in the coming weeks; improving vessel availability and inventory cover would reduce that pressure. Procurement decisions should therefore respond to these operating signals rather than to a single global freight index.
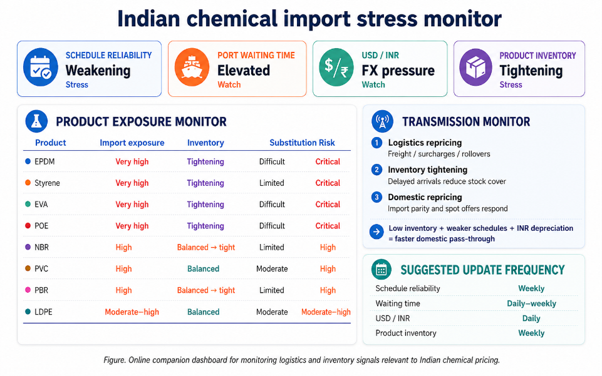
Figure 4. Indian chemical import stress monitor: a companion dashboard combining schedule reliability, port waiting time, USD/INR, inventory conditions and product-level exposure signals. Source: Price Watch™
Final Chemical Market Outlook
The central issue for India is not simply that ocean freight has become more expensive. The larger risk is that reduced effective vessel availability has made the timing and cost of replacement supply less predictable.
Once importers cannot rely on normal vessel rotations, they shorten quotation validity, protect available inventory, ration prompt material and build a risk premium into the next-cargo price.
That mechanism makes import dependence the clearest guide to structural product risk. EPDM, styrene and EVA are the most exposed in the supplied balance, while NBR, PVC, PBR and halo butyl form the next tier.
Products with larger Indian manufacturing bases are better protected, but specialized grades, imported feedstocks and import-parity pricing keep them connected to the same maritime shock. Import dependence identifies where the exposure sits; substitutability, inventory, demand and currency determine how quickly that exposure becomes a price increase.
In the coming weeks, unless effective vessel availability improves materially, Indian chemical prices are expected to increase as delayed arrivals, higher replacement costs and tighter prompt supply move through the market.
The rise should not be uniform across every chemical; the sharpest movements are expected where import dependence is high, substitution is difficult and inventories are thin, while products with stronger domestic supply should experience a slower or more moderate pass-through.
The market is therefore likely to continue moving through the same sequence established in this article: logistics repricing, inventory tightening and domestic repricing.
Conclusion
For Indian buyers, the appropriate response is therefore product- and inventory-specific rather than a broad wait-and-watch strategy. Buyers with adequate stock cover can avoid panic buying and continue disciplined, need-based procurement, while closely tracking vessel reliability, replacement freight, incoming cargo schedules and local inventories.
Buyers with thin stocks or exposure to highly import-dependent and difficult-to-substitute products should secure essential volumes earlier to protect continuity of supply. The key procurement question is not only whether today’s price is high, but whether the next required cargo will be available on time and at a predictable replacement cost.
Follow Price Watch™ on LinkedIn for real-time chemical market intelligence, price trends, supply-chain developments, freight insights, import and export trends, and global commodity updates.